
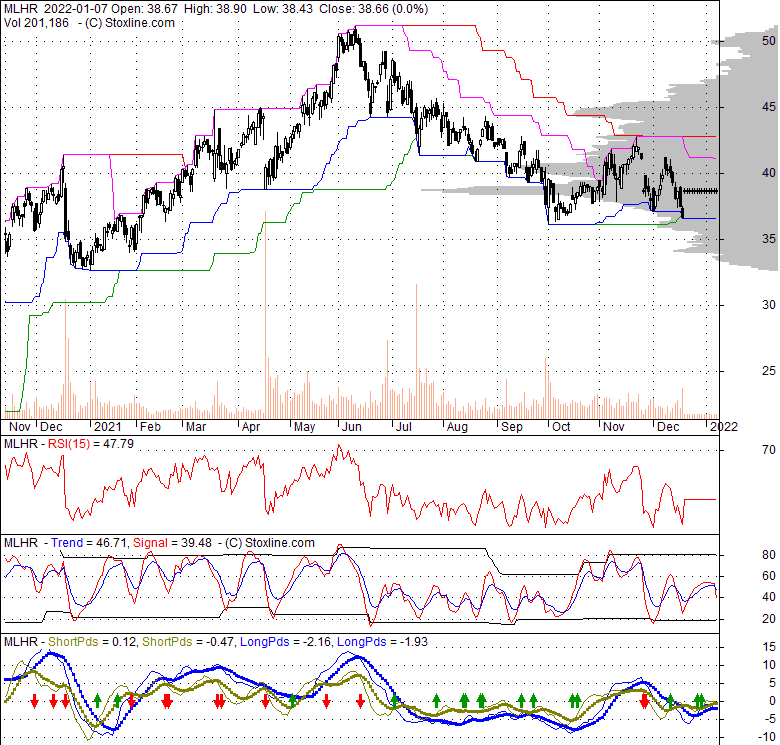
| 38.66 0.03 (0.08%) | 11-01 00:00 | |||||||||||||
|
|
| Short term |  |
|||
| Mid term | |
|||
| Targets | 6-month : | 1-year : | ||
| Resists | First : | Second : | ||
| Pivot price | ||||
| Supports | First : | Second : | ||
| MAs | MA(5) : | MA(20) : | ||
| MA(100) : | MA(250) : | |||
| MACD | MACD : | Signal : | ||
| %K %D | K(14,3) : | D(3) : | ||
| RSI | RSI(14): | |||
| 52-week | High : | Low : | ||
| If tomorrow: | Open lower | Open higher |
| High: | - | - |
| Low: | - | - |
| Close: | - | - |
MillerKnoll, Inc., a global leader in the furnishings sector, specializes in the research, development, manufacturing, and distribution of a diverse array of office furniture systems, seating solutions, standalone furniture pieces, textiles, home furnishings, and related services worldwide. The company's extensive product portfolio encompasses well-known seating lines such as Embody, Aeron, and Mirra2, as well as innovative modular systems like Canvas Office Landscape and Action Office. They also offer storage units under brands like Meridian, elegant wood case goods from Geiger, and adaptable freestanding furniture including Abak. Catering to specialized environments, MillerKnoll provides healthcare products (e.g., Palisade, Nemschoff), ergonomic and technology support tools through the Thrive portfolio and Colebrook Bosson Saunders, and textiles via the Maharam brand. Furthermore, they are at the forefront of connected furnishings with their Live Platform system. For residential settings, their collection features iconic designs from Eames, HAY, and Nelson, among others. These products are utilized across a multitude of environments, including corporate offices, conference and lounge areas, transportation terminals, medical facilities, industrial and educational institutions, and private homes. MillerKnoll strategically markets its offerings through its dedicated sales personnel, proprietary dealer network, independent dealers and retailers, specialized contract office furniture dealers, and an online e-commerce platform. The company, originally established as Herman Miller, Inc., in 1905, maintains its headquarters in Zeeland, Michigan.
Tue, 22 Sep 2026
MillerKnoll stock holds steady as Q1 fiscal 2027 earnings test approaches - ad-hoc-news.de
Tue, 10 Feb 2026
MillerKnoll reports mixed results while MillerKnoll stock trades above EUR 17.90 - AD HOC NEWS
Wed, 20 Oct 2021
Goodmans Interior Structures Becomes Arizona's Exclusive Distributor for Herman Miller and Knoll - Issuewire.com
Tue, 24 Aug 2021
MillerKnoll CEO Andi Owen named one of Fast Company’s 2021 Most Creative People in Business - Biz Today
Thu, 29 Jul 2021
Herman Miller and Knoll Move Forward as MillerKnoll - Architect Magazine
Wed, 21 Jul 2021
Herman Miller and Knoll Announce New Name: MillerKnoll - PR Newswire UK
| Price to Book Value: P/BV, a ratio used to compare book value to its current market price, to gauge whether a stock is valued properly. |
Outperform |
| Price to Earnings: PE, the ratio for valuing a company that measures its current share price relative to its earnings per share (EPS). |
Underperform |
| Discounted cash flow: DCF, a valuation method used to estimate the value of an investment based on its expected future cash flows. |
Outperform |
| Return on Assets: ROA, indicates how profitable a company is in relation to its total assets, how efficiently uses assets to generate a profit. |
Neutral |
| Return on Equity: ROE, a measure of financial performance calculated by dividing net income by equity. a gauge of profitability and efficiency. |
Neutral |
| Debt to Equity: evaluate financial leverage, reflects the ability of equity to cover outstanding debts in the event of a business downturn. |
Outperform |
|
Exchange:
NASDAQ
|
|
|
Sector:
Consumer Cyclical
|
|
|
Industry:
Home Improvement
|
|
| Shares Out | 0 (M) |
| Shares Float | 0 (M) |
| Held by Insiders | (%) |
| Held by Institutions | (%) |
| Shares Short | 0 (K) |
| Shares Short P.Month | 0 (K) |
| EPS | |
| EPS Est Next Qtrly | |
| EPS Est This Year | |
| EPS Est Next Year | |
| Book Value (p.s.) | |
| Profit Margin | % |
| Operating Margin | % |
| Return on Assets (ttm) | % |
| Return on Equity (ttm) | % |
| Qtrly Rev. Growth | % |
| Gross Profit (p.s.) | |
| Sales Per Share | |
| EBITDA (p.s.) | |
| Qtrly Earnings Growth | % |
| Operating Cash Flow | 0 (M) |
| Levered Free Cash Flow | 0 (M) |
| PE Ratio | |
| PEG Ratio | |
| Price to Book value | |
| Price to Sales | |
| Price to Cash Flow |
| Dividend | |
| Forward Dividend | |
| Dividend Yield | 0% |
| Dividend Pay Date | |
| Ex-Dividend Date |

|

|

|

|
|
|
|
|
|