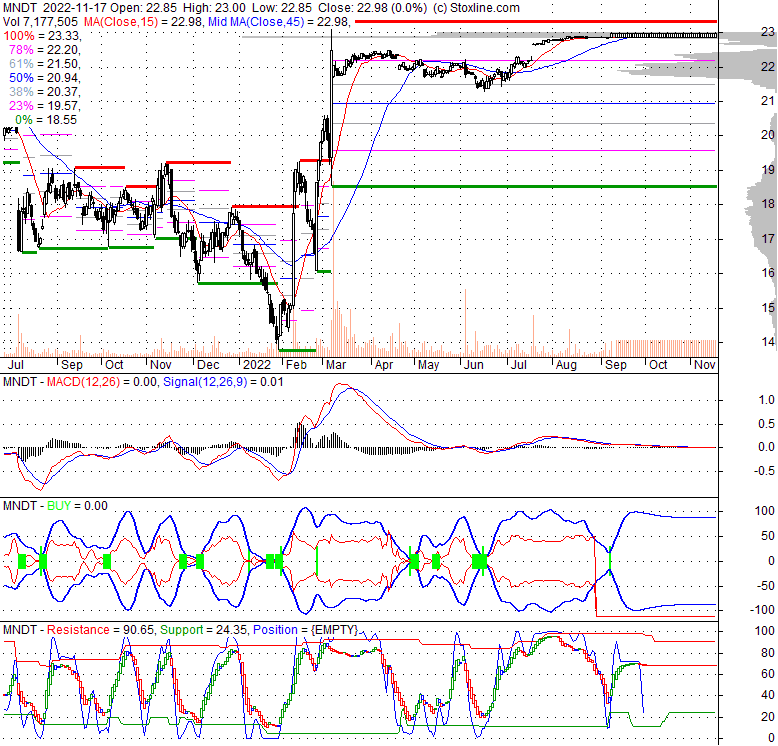
| 22.845 -0.005 (-0.02%) | 09-07 10:38 | |||||||||||||
|
|
| Short term | |
|||
| Mid term | |
|||
| Targets | 6-month : | 26.86 | 1-year : | 31.37 |
| Resists | First : | 23 | Second : | 26.86 |
| Pivot price | 22.97 | |||
| Supports | First : | 22.9 | Second : | 22.85 |
| MAs | MA(5) : | 22.97 | MA(20) : | 22.97 |
| MA(100) : | 22.8 |
MA(250) : | 20.94 |
|
| MACD | MACD : | 0 |
Signal : | 0 |
| %K %D | K(14,3) : | 86.6 | D(3) : | 86.6 |
| RSI | RSI(14): 76.1 | |||
| 52-week | High : | 23.32 | Low : | 13.75 |
Price has closed below its short-term moving average. Short-term moving average is currently below mid-term; and above long-term moving average. From the relationship between price and moving averages: This stock is NEUTRAL in short-term; and NEUTRAL in mid-long term.[ MNDT ] has closed Bollinger Bands are 100% narrower than normal. The narrow width of the bands suggests low volatility as compared to its normal range. The bands have been in this narrow range for 72 bars. This is a sign that the market may be about to initiate a new trend.
| If tomorrow: | Open lower | Open higher |
| High: | 23.05 - 23.17 | 23.17 - 23.26 |
| Low: | 22.53 - 22.69 | 22.69 - 22.82 |
| Close: | 22.76 - 23 | 23 - 23.19 |
Mandiant, Inc. engages in the provision of cyber security solutions. The company, through the Mandiant Advantage SaaS platform, offers threat intelligence, security validation, attack surface management and security automation, as well as managed and consulting services. It also provides Advantage Platform, a multi-vendor XDR platform that delivers the company's expertise and frontline intelligence to security teams; Managed Defense, a solution with comprehensive protection from advanced and emerging threats; and Mandiant Academy, which provides cyber security training services. In addition, the company offers incident response, ransomware, risk management, targeted attack testing, cyber defense transformation, identity first security, industrial control systems and operational technology, cloud architecture, cyber security due diligence, and threat intelligence services. It provides its solutions and services under the Mandiant brand to telecommunications, technology, financial services, public utilities, healthcare, and oil and gas industries, the Unites States and international governmental agencies, as well as educational and nonprofit organizations. The company was formerly known as FireEye, Inc. and changed its name to Mandiant, Inc. in October 2021. Mandiant, Inc. was incorporated in 2004 and is headquartered in Reston, Virginia.
Sun, 07 Apr 2024
Mandiant (MNDT) Completes FireEye Product Business Divestiture - Yahoo Movies Canada
Thu, 04 May 2023
Top Cybersecurity Stocks for Q2 2023 - Investopedia
Fri, 09 Sep 2022
Mandiant stock jumps on Nasdaq notice of last trading day with Google deal (NASDAQ:MNDT) - Seeking Alpha
Fri, 29 Apr 2022
Analyst Rating: Will Mandiant Inc (MNDT) Stock Do Better Than the Market? - InvestorsObserver
Tue, 08 Mar 2022
Mandiant (MNDT) Stock Rallies 16% on Google Takeover Report - Yahoo Finance
Tue, 08 Mar 2022
MNDT Stock Alert: 11 Things to Know About Google's $5.4B Mandiant Deal - InvestorPlace
| Price to Book Value: P/BV, a ratio used to compare book value to its current market price, to gauge whether a stock is valued properly. |
Outperform |
| Price to Earnings: PE, the ratio for valuing a company that measures its current share price relative to its earnings per share (EPS). |
Underperform |
| Discounted cash flow: DCF, a valuation method used to estimate the value of an investment based on its expected future cash flows. |
Outperform |
| Return on Assets: ROA, indicates how profitable a company is in relation to its total assets, how efficiently uses assets to generate a profit. |
Neutral |
| Return on Equity: ROE, a measure of financial performance calculated by dividing net income by equity. a gauge of profitability and efficiency. |
Neutral |
| Debt to Equity: evaluate financial leverage, reflects the ability of equity to cover outstanding debts in the event of a business downturn. |
Outperform |

|
Exchange:
NASDAQ
|
|
|
Sector:
Technology
|
|
|
Industry:
Software - Infrastructure
|
|
| Shares Out | 0 (M) |
| Shares Float | 0 (M) |
| Held by Insiders | 0 (%) |
| Held by Institutions | 0 (%) |
| Shares Short | 0 (K) |
| Shares Short P.Month | 0 (K) |
| EPS | 0 |
| EPS Est Next Qtrly | 0 |
| EPS Est This Year | 0 |
| EPS Est Next Year | 0 |
| Book Value (p.s.) | 0 |
| Profit Margin | 0 % |
| Operating Margin | 0 % |
| Return on Assets (ttm) | 0 % |
| Return on Equity (ttm) | 0 % |
| Qtrly Rev. Growth | 0 % |
| Gross Profit (p.s.) | 0.95 |
| Sales Per Share | 2.07 |
| EBITDA (p.s.) | -1.09 |
| Qtrly Earnings Growth | 0 % |
| Operating Cash Flow | 0 (M) |
| Levered Free Cash Flow | 0 (M) |
| PE Ratio | 0 |
| PEG Ratio | 0 |
| Price to Book value | 0 |
| Price to Sales | 11.05 |
| Price to Cash Flow | 0 |
| Dividend | 0 |
| Forward Dividend | 0 |
| Dividend Yield | 0% |
| Dividend Pay Date | Invalid DateTime. |
| Ex-Dividend Date | Invalid DateTime. |