
| 85.19 1.68 (2.01%) | 08-21 16:00 | |||||||||||||
|
|
| Short term |  |
|||
| Mid term |  |
|||
| Targets | 6-month : | 99.61 |
1-year : | 116.35 |
| Resists | First : | 85.29 |
Second : | 99.61 |
| Pivot price | 81.77 |
|||
| Supports | First : | 82.26 |
Second : | 80.38 |
| MAs | MA(5) : | 82.68 |
MA(20) : | 82.1 |
| MA(100) : | 81.54 |
MA(250) : | 77.89 |
|
| MACD | MACD : | 0.4 |
Signal : | 0.2 |
| %K %D | K(14,3) : | 77.2 |
D(3) : | 54.6 |
| RSI | RSI(14): 70.9 |
|||
| 52-week | High : | 86.55 | Low : | 67.64 |
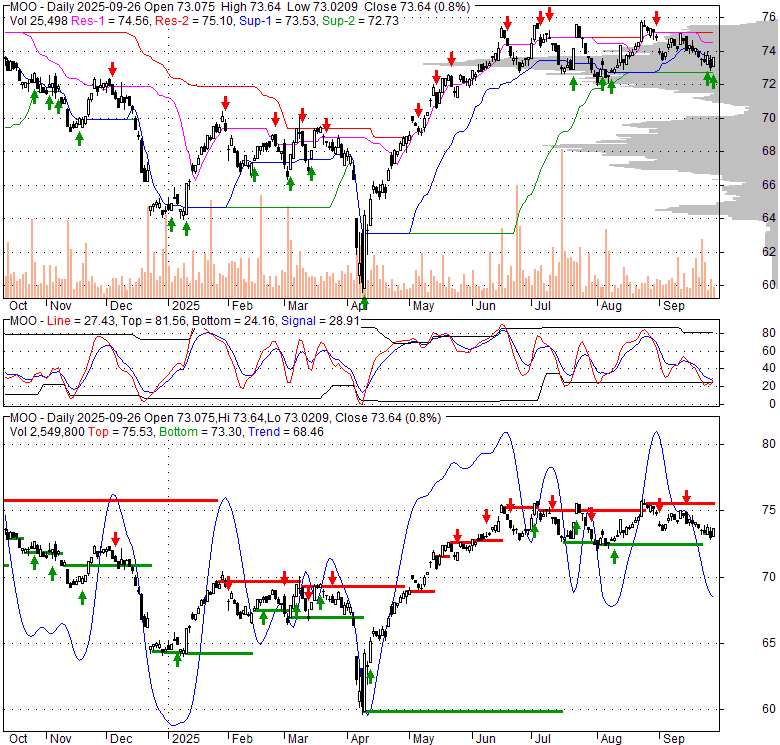
Price has closed above its short-term moving average. Short-term moving average is currently above mid-term; and above long-term moving average. From the relationship between price and moving averages: This stock is BULLISH in short-term; and NEUTRAL in mid-long term.[ MOO ] has closed Bollinger Bands are 5.2% wider than normal. The current width of the bands does not suggest anything about the future direction or movement of prices.
| If tomorrow: | Open lower | Open higher |
| High: | 85.3 - 85.6 | 85.6 - 85.87 |
| Low: | 83.16 - 83.55 | 83.55 - 83.91 |
| Close: | 84.63 - 85.17 | 85.17 - 85.67 |
The VanEck Agribusiness ETF, trading under the symbol MOO, is an investment fund engineered to closely reflect the total financial returns—encompassing both capital gains and income generation—of its benchmark, the MVISGlobal Agribusiness Index (MVMOOTR), before accounting for any fund expenses. This index is specifically constructed to capture the collective performance of businesses operating across the diverse spectrum of the agribusiness industry. This includes firms specializing in agricultural chemicals, animal healthcare, and fertilizers; companies involved in seeds and genetic traits; manufacturers of farming and irrigation equipment and machinery; enterprises engaged in aquaculture and fishing; livestock farming operations; and entities dedicated to cultivation and plantations, covering a broad range of products such as grains, oil palms, sugarcane, tobacco leaves, and grapevines. Furthermore, the ETF encompasses companies active in the commerce and distribution of agricultural goods.
Fri, 21 Aug 2026
El Nino Raises Risks: ETF Areas Likely to Benefit - TradingView
Thu, 20 Aug 2026
VanEck Agribusiness ETF (MOO) stays a Buy as ri... - Pluang
Thu, 20 Aug 2026
Update On The MOO ETF (NYSEARCA:MOO) - Seeking Alpha
Wed, 19 Aug 2026
VanEck Agribusiness ETF (MOO) Stock Price, Chart & News Today - CoinGecko
Mon, 17 Aug 2026
VanEck lines up agribusiness ETF as food security theme returns to focus - QuotedData
Fri, 14 Aug 2026
VanEck Agribusiness ETF (MOO) offers global agr... - Pluang
| Price to Book Value: P/BV, a ratio used to compare book value to its current market price, to gauge whether a stock is valued properly. |
Neutral |
| Price to Earnings: PE, the ratio for valuing a company that measures its current share price relative to its earnings per share (EPS). |
Neutral |
| Discounted cash flow: DCF, a valuation method used to estimate the value of an investment based on its expected future cash flows. |
Neutral |
| Return on Assets: ROA, indicates how profitable a company is in relation to its total assets, how efficiently uses assets to generate a profit. |
Neutral |
| Return on Equity: ROE, a measure of financial performance calculated by dividing net income by equity. a gauge of profitability and efficiency. |
Neutral |
| Debt to Equity: evaluate financial leverage, reflects the ability of equity to cover outstanding debts in the event of a business downturn. |
Neutral |
|
Exchange:
AMEX
|
|
|
Sector:
Financial Services
|
|
|
Industry:
Asset Management
|
|
| Shares Out | 0 (M) |
| Shares Float | 0 (M) |
| Held by Insiders | 0 (%) |
| Held by Institutions | 0 (%) |
| Shares Short | 0 (K) |
| Shares Short P.Month | 0 (K) |
| EPS | 0 |
| EPS Est Next Qtrly | 0 |
| EPS Est This Year | 0 |
| EPS Est Next Year | 0 |
| Book Value (p.s.) | 0 |
| Profit Margin | 0 % |
| Operating Margin | 0 % |
| Return on Assets (ttm) | 0 % |
| Return on Equity (ttm) | 0 % |
| Qtrly Rev. Growth | 0 % |
| Gross Profit (p.s.) | 0 |
| Sales Per Share | 0 |
| EBITDA (p.s.) | 0 |
| Qtrly Earnings Growth | 0 % |
| Operating Cash Flow | 0 (M) |
| Levered Free Cash Flow | 0 (M) |
| PE Ratio | 0 |
| PEG Ratio | 0 |
| Price to Book value | 0 |
| Price to Sales | 0 |
| Price to Cash Flow | 0 |
| Dividend | 0 |
| Forward Dividend | 0 |
| Dividend Yield | 0% |
| Dividend Pay Date | Invalid DateTime. |
| Ex-Dividend Date | Invalid DateTime. |

|

|
|

|
|
|
|
|
|