
| 23.9401 0 (0%) | 10-07 16:00 | |||||||||||||
|
|
| Short term |  |
|||
| Mid term |  |
|||
| Targets | 6-month : | 28.19 | 1-year : | 28.42 |
| Resists | First : | 24.13 | Second : | 24.34 |
| Pivot price | 23.99  |
|||
| Supports | First : | 23.8 | Second : | 19.8 |
| MAs | MA(5) : | 23.91  |
MA(20) : | 24.02 |
| MA(100) : | 24.28 |
MA(250) : | 24.26 |
|
| MACD | MACD : | -0.1 |
Signal : | -0.1 |
| %K %D | K(14,3) : | 32.3 |
D(3) : | 26.8 |
| RSI | RSI(14): 35.5 |
|||
| 52-week | High : | 24.57 | Low : | 23.8 |
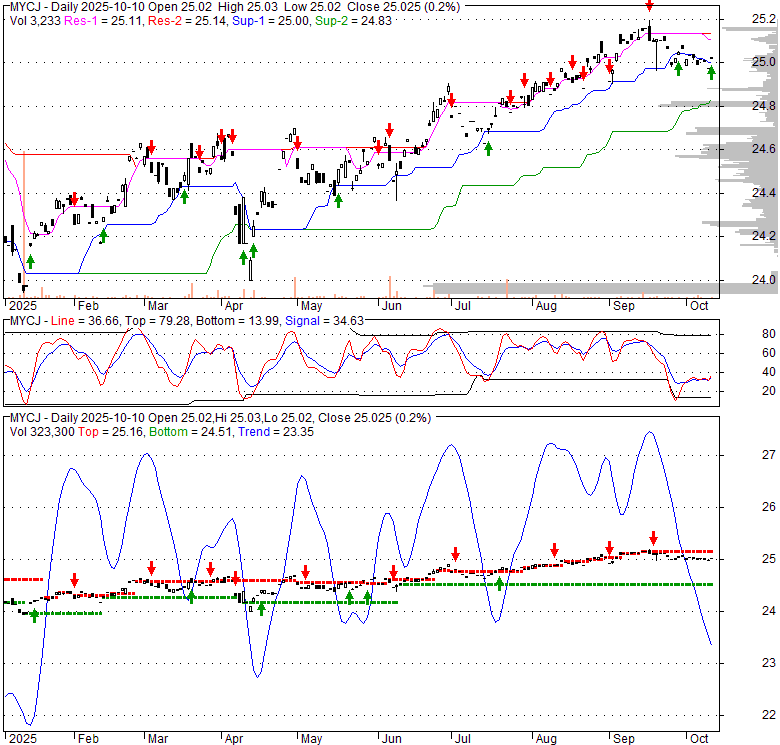
Price has closed above its short-term moving average. Short-term moving average is currently below mid-term; and below long-term moving average. From the relationship between price and moving averages: This stock is NEUTRAL in short-term; and BEARISH in mid-long term.[ MYCJ ] has closed above bottom band by 36.1%. Bollinger Bands are 67.2% wider than normal. The large width of the bands suggest high volatility as compared to its normal range. The bands have been in this wide range for 19 days. This is a sign that the current trend might continue.
| If tomorrow: | Open lower | Open higher |
| High: | 23.99 - 24.08 | 24.08 - 24.18 |
| Low: | 23.64 - 23.75 | 23.75 - 23.85 |
| Close: | 23.77 - 23.95 | 23.95 - 24.13 |
The State Street My2030 Corporate Bond ETF (MYCJ) is an actively managed investment vehicle that primarily invests in corporate debt instruments scheduled to mature in the year 2030. This fund is structured as a target maturity ETF, meaning it is designed to distribute its remaining principal and conclude its operations around December 15, 2030. Its core investment mandate is to optimize current income for shareholders while concurrently safeguarding their invested capital. The management team employs a sophisticated, risk-conscious strategy that integrates a high-level market perspective with detailed, granular analysis of individual securities. This involves rigorous fundamental research to identify and selectively overweight the most compelling sectors and issuers within the corporate bond market. MYCJ belongs to the State Street MyIncome ETF family, a suite of target maturity products that empower investors to construct bespoke bond ladder portfolios. This structure is particularly beneficial for mitigating interest rate volatility, optimizing cash flow management, and addressing specific liquidity demands.
Thu, 23 Jul 2026
7 Best ETFs to Invest in Corporate Bonds - US News Money
Thu, 26 Mar 2026
Fashionably Late, But Low-Cost: Vanguard Joins Target-Maturity Party - ETF Trends
Thu, 26 Feb 2026
State Street Unveils High Yield Target Maturity ETF Suite - ETF Trends
| Price to Book Value: P/BV, a ratio used to compare book value to its current market price, to gauge whether a stock is valued properly. |
Neutral |
| Price to Earnings: PE, the ratio for valuing a company that measures its current share price relative to its earnings per share (EPS). |
Neutral |
| Discounted cash flow: DCF, a valuation method used to estimate the value of an investment based on its expected future cash flows. |
Neutral |
| Return on Assets: ROA, indicates how profitable a company is in relation to its total assets, how efficiently uses assets to generate a profit. |
Neutral |
| Return on Equity: ROE, a measure of financial performance calculated by dividing net income by equity. a gauge of profitability and efficiency. |
Neutral |
| Debt to Equity: evaluate financial leverage, reflects the ability of equity to cover outstanding debts in the event of a business downturn. |
Neutral |
|
Exchange:
NASDAQ
|
|
|
Sector:
Financial Services
|
|
|
Industry:
Asset Management - Bonds
|
|
| Shares Out | 0 (M) |
| Shares Float | 0 (M) |
| Held by Insiders | 0 (%) |
| Held by Institutions | 0 (%) |
| Shares Short | 0 (K) |
| Shares Short P.Month | 0 (K) |
| EPS | 0 |
| EPS Est Next Qtrly | 0 |
| EPS Est This Year | 0 |
| EPS Est Next Year | 0 |
| Book Value (p.s.) | 0 |
| Profit Margin | 0 % |
| Operating Margin | 0 % |
| Return on Assets (ttm) | 0 % |
| Return on Equity (ttm) | 0 % |
| Qtrly Rev. Growth | 0 % |
| Gross Profit (p.s.) | 0 |
| Sales Per Share | 0 |
| EBITDA (p.s.) | 0 |
| Qtrly Earnings Growth | 0 % |
| Operating Cash Flow | 0 (M) |
| Levered Free Cash Flow | 0 (M) |
| PE Ratio | 0 |
| PEG Ratio | 0 |
| Price to Book value | 0 |
| Price to Sales | 0 |
| Price to Cash Flow | 0 |
| Dividend | 0 |
| Forward Dividend | 0 |
| Dividend Yield | 0% |
| Dividend Pay Date | Invalid DateTime. |
| Ex-Dividend Date | Invalid DateTime. |

|

|

|

|
|
|
|
|
|