
| 24.0114 0.091 (0.38%) | 10-13 16:00 | |||||||||||||
|
|
| Short term |   |
|||
| Mid term |  |
|||
| Targets | 6-month : | 28.27  |
1-year : | 28.54 |
| Resists | First : | 24.21 |
Second : | 24.43 |
| Pivot price | 23.96 |
|||
| Supports | First : | 23.84 | Second : | 19.83 |
| MAs | MA(5) : | 23.93 |
MA(20) : | 24.04 |
| MA(100) : | 24.43 |
MA(250) : | 24.4 |
|
| MACD | MACD : | -0.2 |
Signal : | -0.2 |
| %K %D | K(14,3) : | 32.1 |
D(3) : | 22.8 |
| RSI | RSI(14): 43.3 |
|||
| 52-week | High : | 24.69 | Low : | 23.84 |
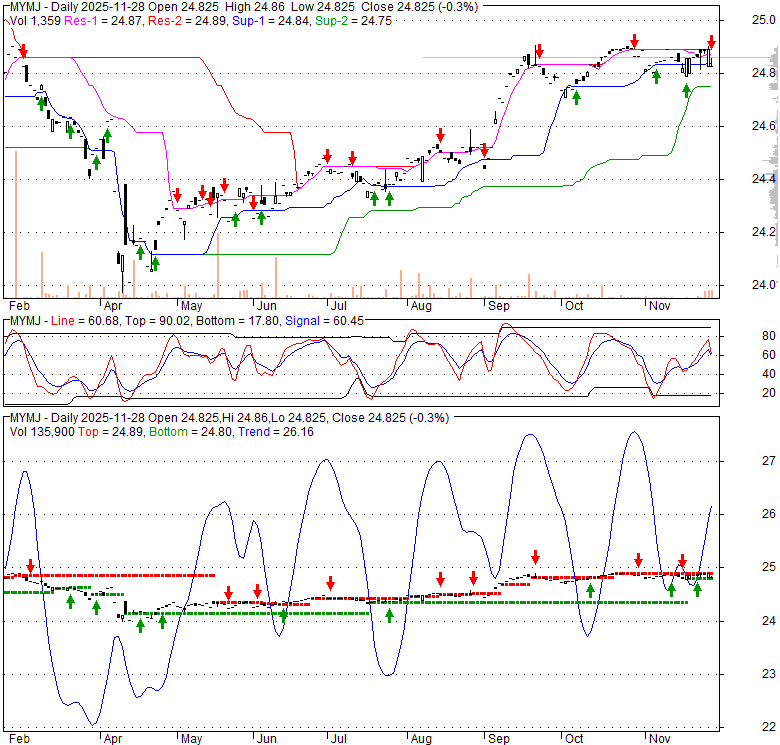
Price has closed above its short-term moving average. Short-term moving average is currently below mid-term; and below long-term moving average. From the relationship between price and moving averages: This stock is NEUTRAL in short-term; and BEARISH in mid-long term.[ MYMJ ] has closed below upper band by 34.8%. Bollinger Bands are 45.5% wider than normal. The large width of the bands suggest high volatility as compared to its normal range. The bands have been in this wide range for 23 days. This is a sign that the current trend might continue.
| If tomorrow: | Open lower | Open higher |
| High: | 24.03 - 24.14 | 24.14 - 24.25 |
| Low: | 23.71 - 23.85 | 23.85 - 23.97 |
| Close: | 23.79 - 24 | 24 - 24.2 |
The State Street My2030 Municipal Bond ETF is an actively managed investment vehicle primarily focused on municipal bonds scheduled to mature in 2030. Its structure dictates that it will distribute remaining principal and cease operations around December 15, 2030. Its core objectives are to maximize current income, which is exempt from regular federal income taxes, and to preserve capital. This is accomplished through a risk-conscious investment strategy that employs a top-down macro perspective alongside rigorous bottom-up fundamental research. This dual approach allows the portfolio to strategically overweigh the most attractive sectors and issuers. As part of the State Street MyIncome ETF series, this fund offers investors a streamlined way to construct tailored bond ladder portfolios. This functionality aids in effectively managing interest rate risk, optimizing cash flow, and addressing liquidity requirements.
Tue, 16 Sep 2025
State Street My2031 Municipal Bond ETF (MYMK) Stock Price, News, Quote & History - Yahoo! Finance Canada
Tue, 12 Nov 2024
Q3 2024 ETF Launches - NYSE
| Price to Book Value: P/BV, a ratio used to compare book value to its current market price, to gauge whether a stock is valued properly. |
Neutral |
| Price to Earnings: PE, the ratio for valuing a company that measures its current share price relative to its earnings per share (EPS). |
Neutral |
| Discounted cash flow: DCF, a valuation method used to estimate the value of an investment based on its expected future cash flows. |
Neutral |
| Return on Assets: ROA, indicates how profitable a company is in relation to its total assets, how efficiently uses assets to generate a profit. |
Neutral |
| Return on Equity: ROE, a measure of financial performance calculated by dividing net income by equity. a gauge of profitability and efficiency. |
Neutral |
| Debt to Equity: evaluate financial leverage, reflects the ability of equity to cover outstanding debts in the event of a business downturn. |
Neutral |
|
Exchange:
NASDAQ
|
|
|
Sector:
Financial Services
|
|
|
Industry:
Asset Management - Bonds
|
|
| Shares Out | 0 (M) |
| Shares Float | 0 (M) |
| Held by Insiders | 0 (%) |
| Held by Institutions | 0 (%) |
| Shares Short | 0 (K) |
| Shares Short P.Month | 0 (K) |
| EPS | 0 |
| EPS Est Next Qtrly | 0 |
| EPS Est This Year | 0 |
| EPS Est Next Year | 0 |
| Book Value (p.s.) | 0 |
| Profit Margin | 0 % |
| Operating Margin | 0 % |
| Return on Assets (ttm) | 0 % |
| Return on Equity (ttm) | 0 % |
| Qtrly Rev. Growth | 0 % |
| Gross Profit (p.s.) | 0 |
| Sales Per Share | 0 |
| EBITDA (p.s.) | 0 |
| Qtrly Earnings Growth | 0 % |
| Operating Cash Flow | 0 (M) |
| Levered Free Cash Flow | 0 (M) |
| PE Ratio | 0 |
| PEG Ratio | 0 |
| Price to Book value | 0 |
| Price to Sales | 0 |
| Price to Cash Flow | 0 |
| Dividend | 0 |
| Forward Dividend | 0 |
| Dividend Yield | 0% |
| Dividend Pay Date | Invalid DateTime. |
| Ex-Dividend Date | Invalid DateTime. |

|

|

|

|
|
|
|
|
|