
| 114.855 0.955 (0.84%) | 10-05 11:56 | |||||||||||||
|
|
| Short term |  |
|||
| Mid term |  |
|||
| Targets | 6-month : | 150.09 | 1-year : | 175.31 |
| Resists | First : | 128.5 | Second : | 150.09 |
| Pivot price | 111.24  |
|||
| Supports | First : | 109.3 | Second : | 97.44 |
| MAs | MA(5) : | 112.58 |
MA(20) : | 108.59 |
| MA(100) : | 98.74 |
MA(250) : | 108.16  |
|
| MACD | MACD : | 2.9 |
Signal : | 2.7 |
| %K %D | K(14,3) : | 52.1 |
D(3) : | 49.4 |
| RSI | RSI(14): 58.1 |
|||
| 52-week | High : | 140.17 | Low : | 83.09 |
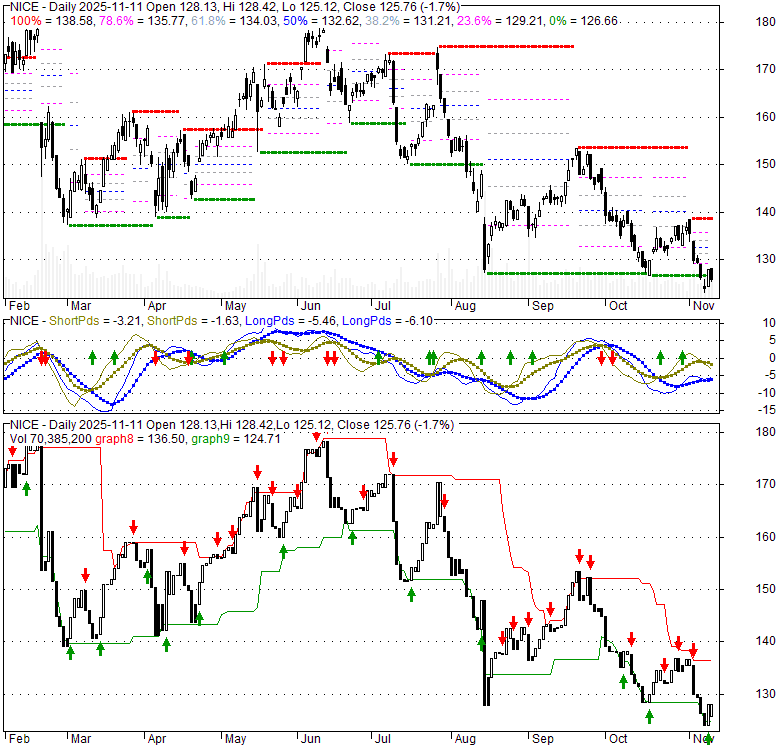
Price has closed above its short-term moving average. Short-term moving average is currently above mid-term; and above long-term moving average. From the relationship between price and moving averages: This stock is BULLISH in short-term; and BULLISH in mid-long term.[ NICE ] has closed below upper band by 33.3%. Bollinger Bands are 2.3% wider than normal. The current width of the bands does not suggest anything about the future direction or movement of prices.
| If tomorrow: | Open lower | Open higher |
| High: | 118.23 - 118.9 | 118.9 - 119.52 |
| Low: | 111.26 - 111.98 | 111.98 - 112.63 |
| Close: | 112.86 - 114.02 | 114.02 - 115.07 |
NICE Ltd., together with its subsidiaries, provides AI-powered cloud platforms for customer engagement, and financial crime and compliance in the United States, Europe, the Middle East, Africa, and the Asia Pacific. It operates in two segments, Customer Engagement; and Financial Crime and Compliance. The Customer Engagement segment provides CXone Mpower platform for organizations to automate service, augment the workforce with AI-powered solutions, and unify enterprise knowledge, data and AI models resolutions, and customer experiences. The Financial Crime and Compliance segment offers embedded-AI solutions that identify risks and help prevent money laundering and fraud, as well as help ensure financial markets compliance in real-time. It also provides NICE Evidencentral, a digital evidence management and investigation platform for criminal justice system. In addition, the company offers NiCE Actimize provides cloud platforms embedded with AI capabilities for real-time and cross-channel fraud prevention, know-your-customer, anti-money laundering, and capital markets compliance; X-Sight, an open AI-cloud platform for Financial Crime and Compliance, enabling financial services organizations; Xceed which provides AI, data intelligence, machine learning, and insights for AML and fraud prevention for small and mid-sized organizations; cloud platforms provide financial services organizations with the agility required to adapt changing regulatory and threat landscapes; data intelligence solutions enable organizations to turn raw data into actionable intelligence to prevent and detect financial crimes; AI and analytics; intelligent investigations solutions; and self-service solutions. The company was formerly known as NICE-Systems Ltd. and changed its name to NICE Ltd. in June 2016. NICE Ltd. was incorporated in 1986 and is headquartered in Ra'anana, Israel.
Mon, 05 Oct 2026
Oppenheimer upgrades NICE stock to Outperform at USD 150.00 - AD HOC NEWS
Fri, 02 Oct 2026
Form 4 NICE Ltd. For: 2 October By Investing.com - Investing.com Canada
Thu, 01 Oct 2026
NiCE Named a Leader in the IDC MarketScape for Worldwide Agentic Contact Center-as-a-Service Platforms - Yahoo Finance
Wed, 30 Sep 2026
NICE Ltd (NICE) Shares Surge 4.1% -- What GF Score of 89 Tells I - GuruFocus
Wed, 30 Sep 2026
NICE Ltd. stays a Buy as AI growth and low valu... - Pluang
Wed, 30 Sep 2026
NICE: Growth Numbers Look Ugly, But The Setup Is Improving (NASDAQ:NICE) - Seeking Alpha
| Price to Book Value: P/BV, a ratio used to compare book value to its current market price, to gauge whether a stock is valued properly. |
Outperform |
| Price to Earnings: PE, the ratio for valuing a company that measures its current share price relative to its earnings per share (EPS). |
Neutral |
| Discounted cash flow: DCF, a valuation method used to estimate the value of an investment based on its expected future cash flows. |
Outperform |
| Return on Assets: ROA, indicates how profitable a company is in relation to its total assets, how efficiently uses assets to generate a profit. |
Outperform |
| Return on Equity: ROE, a measure of financial performance calculated by dividing net income by equity. a gauge of profitability and efficiency. |
Neutral |
| Debt to Equity: evaluate financial leverage, reflects the ability of equity to cover outstanding debts in the event of a business downturn. |
Neutral |
|
Exchange:
NASDAQ
|
|
|
Sector:
Technology
|
|
|
Industry:
Software - Application
|
|
| Shares Out | 59 (M) |
| Shares Float | 1,460 (M) |
| Held by Insiders | 0 (%) |
| Held by Institutions | 62.4 (%) |
| Shares Short | 1,490 (K) |
| Shares Short P.Month | 2,610 (K) |
| EPS | 6.86 |
| EPS Est Next Qtrly | 0 |
| EPS Est This Year | 0 |
| EPS Est Next Year | 0 |
| Book Value (p.s.) | 2.56 |
| Profit Margin | 13.8 % |
| Operating Margin | 13.8 % |
| Return on Assets (ttm) | 6.9 % |
| Return on Equity (ttm) | 11.3 % |
| Qtrly Rev. Growth | 7.5 % |
| Gross Profit (p.s.) | 34.12 |
| Sales Per Share | 52.38 |
| EBITDA (p.s.) | 13.92 |
| Qtrly Earnings Growth | -52.8 % |
| Operating Cash Flow | 672 (M) |
| Levered Free Cash Flow | 615 (M) |
| PE Ratio | 16.65 |
| PEG Ratio | 0.7 |
| Price to Book value | 44.53 |
| Price to Sales | 2.18 |
| Price to Cash Flow | 9.97 |
| Dividend | 0.15 |
| Forward Dividend | 0 |
| Dividend Yield | 0.1% |
| Dividend Pay Date | Invalid DateTime. |
| Ex-Dividend Date | Invalid DateTime. |

|

|

|

|
|
|
|
|
|