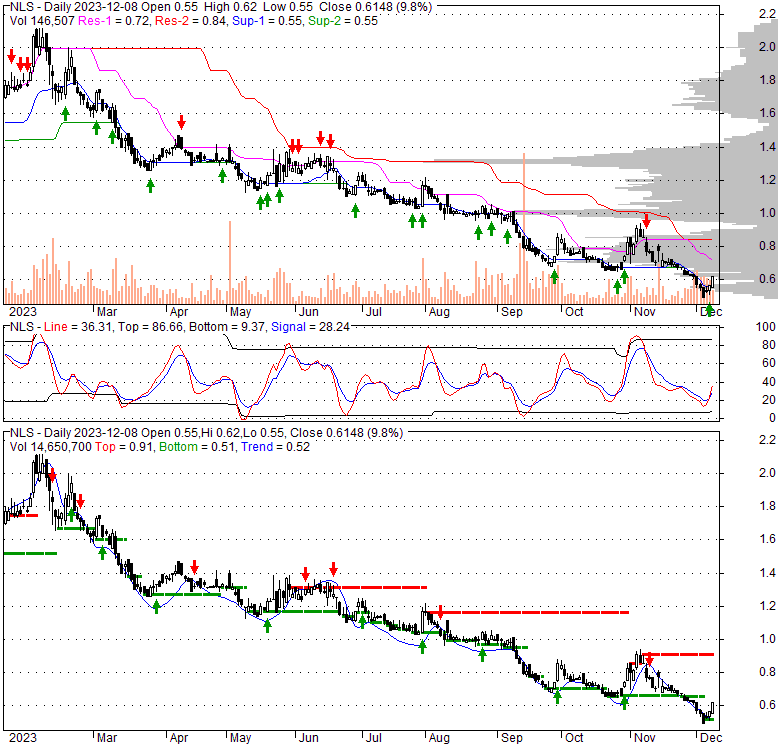
| 0.8204 0.083 (11.2%) | 10-31 16:00 | |||||||||||||
|
|
| Short term | |
|||
| Mid term | ||||
| Targets | 6-month : | 0.89 | 1-year : | 1.1 |
| Resists | First : | 0.76 | Second : | 0.94 |
| Pivot price | 0.61 |
|||
| Supports | First : | 0.48 | Second : | 0.4 |
| MAs | MA(5) : | 0.54 |
MA(20) : | 0.64 |
| MA(100) : | 0.83 |
MA(250) : | 1.2 |
|
| MACD | MACD : | -0.1 |
Signal : | -0.1 |
| %K %D | K(14,3) : | 34.3 |
D(3) : | 20.3 |
| RSI | RSI(14): 45.3 |
|||
| 52-week | High : | 2.17 | Low : | 0.48 |
Price has closed above its short-term moving average. Short-term moving average is currently below mid-term; and below long-term moving average. From the relationship between price and moving averages: This stock is NEUTRAL in short-term; and BEARISH in mid-long term.[ NLS ] has closed above bottom band by 50.0%. Bollinger Bands are 17.4% wider than normal. The current width of the bands does not suggest anything about the future direction or movement of prices.
| If tomorrow: | Open lower | Open higher |
| High: | 0.62 - 0.62 | 0.62 - 0.63 |
| Low: | 0.54 - 0.55 | 0.55 - 0.55 |
| Close: | 0.61 - 0.62 | 0.62 - 0.62 |
Nautilus, Inc., a fitness solutions company, designs, develops, sources, and markets cardio and strength fitness products, and related accessories for consumer and commercial use in the United States, Canada, Europe, the Middle East, Africa, and internationally. The company operates in two segments, Direct and Retail. It offers specialized cardio products, treadmills, ellipticals, bike products, home gyms, dumbbells, barbells, and kettlebells primarily under the Nautilus, Bowflex, Octane Fitness, and Schwinn brands, as well as fitness digital platform under the JRNY brand. In addition, it engages in licensing its brands and intellectual properties. The company offers its products directly to consumers through television advertising, social media, websites, and catalogs; and through a network of retail companies consisting of sporting goods stores, online retailers, electronics stores, furniture stores, and large-format and warehouse stores, as well as specialty retailers and independent bike dealers. Nautilus, Inc. was founded in 1986 and is headquartered in Vancouver, Washington.
Wed, 17 Apr 2024
Announcing: Nautilus (NYSE:NLS) Stock Soared An Exciting 465% In The Last Year - Yahoo Movies Canada
Wed, 01 Nov 2023
Nautilus, Inc. Rebrands as BowFlex Inc. - Business Wire
Fri, 20 Oct 2023
Nautilus, Inc. Announces Plans to Change Corporate Name to BowFlex Inc. - American Spa
Mon, 02 Oct 2023
Nautilus (NYSE:NLS) Has Debt But No Earnings; Should You Worry? - Simply Wall St
Wed, 27 Sep 2023
Nautilus, Inc. Gets Stock Delisting Warning - SGB Media
Wed, 27 Sep 2023
BowFlex Parent, Nautilus, Inc. Announces Receipt of Notice of Non-Compliance with NYSE Trading Share Price Listing ... - American Spa
| Price to Book Value: P/BV, a ratio used to compare book value to its current market price, to gauge whether a stock is valued properly. |
Underperform |
| Price to Earnings: PE, the ratio for valuing a company that measures its current share price relative to its earnings per share (EPS). |
Underperform |
| Discounted cash flow: DCF, a valuation method used to estimate the value of an investment based on its expected future cash flows. |
Outperform |
| Return on Assets: ROA, indicates how profitable a company is in relation to its total assets, how efficiently uses assets to generate a profit. |
Underperform |
| Return on Equity: ROE, a measure of financial performance calculated by dividing net income by equity. a gauge of profitability and efficiency. |
Underperform |
| Debt to Equity: evaluate financial leverage, reflects the ability of equity to cover outstanding debts in the event of a business downturn. |
Outperform |

|
Exchange:
NYSE
|
|
|
Sector:
Consumer Cyclical
|
|
|
Industry:
Leisure
|
|
| Shares Out | 36 (M) |
| Shares Float | 30 (M) |
| Held by Insiders | 11.3 (%) |
| Held by Institutions | 20.5 (%) |
| Shares Short | 907 (K) |
| Shares Short P.Month | 843 (K) |
| EPS | -1.63 |
| EPS Est Next Qtrly | 0 |
| EPS Est This Year | 0 |
| EPS Est Next Year | 0 |
| Book Value (p.s.) | 6.4 |
| Profit Margin | 14.5 % |
| Operating Margin | 9.6 % |
| Return on Assets (ttm) | 28.6 % |
| Return on Equity (ttm) | 75.4 % |
| Qtrly Rev. Growth | 61.7 % |
| Gross Profit (p.s.) | 0 |
| Sales Per Share | 20.37 |
| EBITDA (p.s.) | 3.95 |
| Qtrly Earnings Growth | 0 % |
| Operating Cash Flow | 0 (M) |
| Levered Free Cash Flow | 0 (M) |
| PE Ratio | -0.38 |
| PEG Ratio | -0.2 |
| Price to Book value | 0.09 |
| Price to Sales | 0.03 |
| Price to Cash Flow | 0 |
| Dividend | 0 |
| Forward Dividend | 0 |
| Dividend Yield | 0% |
| Dividend Pay Date | Invalid DateTime. |
| Ex-Dividend Date | Invalid DateTime. |