| 0 (0%) | 04-26 20:51 | |||||||||||||
|
|
| Short term | ||||
| Mid term | ||||
| Targets | 6-month : | 6.07 | 1-year : | 6.71 |
| Resists | First : | 5.2 | Second : | 5.75 |
| Pivot price | 4.69 |
|||
| Supports | First : | 4.32 | Second : | 3.59 |
| MAs | MA(5) : | 4.57 |
MA(20) : | 4.87 |
| MA(100) : | 4.34 |
MA(250) : | 3.98 |
|
| MACD | MACD : | -0.1 |
Signal : | -0.1 |
| %K %D | K(14,3) : | 19.7 |
D(3) : | 21.3 |
| RSI | RSI(14): 41.7 |
|||
| 52-week | High : | 5.75 | Low : | 2.5 |
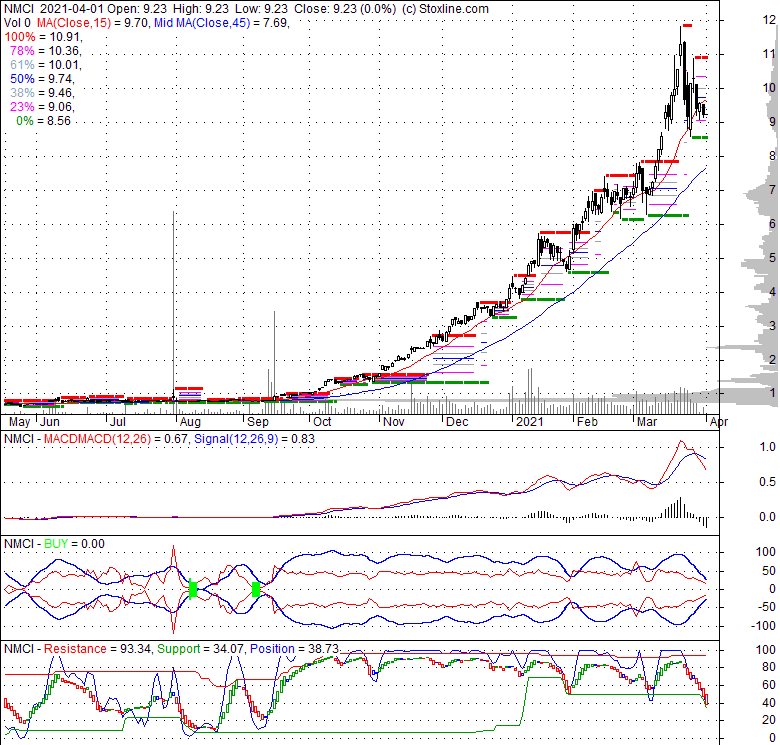
Price has closed below its short-term moving average. Short-term moving average is currently below mid-term; and above long-term moving average. From the relationship between price and moving averages: This stock is BEARISH in short-term; and NEUTRAL in mid-long term.[ NCMI ] has closed above bottom band by 25.7%. Bollinger Bands are 9.4% wider than normal. The current width of the bands does not suggest anything about the future direction or movement of prices.
| If tomorrow: | Open lower | Open higher |
| High: | 4.64 - 4.67 | 4.67 - 4.69 |
| Low: | 4.39 - 4.43 | 4.43 - 4.46 |
| Close: | 4.42 - 4.47 | 4.47 - 4.51 |
Wed, 17 Jan 2024
Irish maritime college puts in place programme to combat sexual misconduct and violence - Nautilus International
Sat, 06 Jan 2024
Maritime College head: Ireland must seize opportunities presented by major off-shore projects - TheJournal.ie
Sun, 19 Nov 2023
'Realising Ireland's Maritime Ambition' - NMCI's Seafarer's Conference 2024 is Announced - Afloat
Fri, 10 Nov 2023
Hundreds of students attend open day at NMCI campus in Cork - Irish Independent
Fri, 19 May 2023
Navy ready to start implementing fixes to notoriously slow computers - Federal News Network
Tue, 29 Nov 2022
Navy Reserve Rolls Out Game-Changing Azure Virtual Desktop with Access to NMCI Resources on Personal Devices - DVIDS
| Price to Book Value: P/BV, a ratio used to compare book value to its current market price, to gauge whether a stock is valued properly. |
Neutral |
| Price to Earnings: PE, the ratio for valuing a company that measures its current share price relative to its earnings per share (EPS). |
Outperform |
| Discounted cash flow: DCF, a valuation method used to estimate the value of an investment based on its expected future cash flows. |
Outperform |
| Return on Assets: ROA, indicates how profitable a company is in relation to its total assets, how efficiently uses assets to generate a profit. |
Neutral |
| Return on Equity: ROE, a measure of financial performance calculated by dividing net income by equity. a gauge of profitability and efficiency. |
Neutral |
| Debt to Equity: evaluate financial leverage, reflects the ability of equity to cover outstanding debts in the event of a business downturn. |
Outperform |
|
Exchange:
|
|
|
Sector:
|
|
|
Industry:
|
|
| Shares Out | 97 (M) |
| Shares Float | 62 (M) |
| Held by Insiders | 4.7 (%) |
| Held by Institutions | 74 (%) |
| Shares Short | 4,010 (K) |
| Shares Short P.Month | 3,450 (K) |
| EPS | 14.34 |
| EPS Est Next Qtrly | 0 |
| EPS Est This Year | 0 |
| EPS Est Next Year | 0 |
| Book Value (p.s.) | 4.48 |
| Profit Margin | 426.8 % |
| Operating Margin | 22.4 % |
| Return on Assets (ttm) | -2.6 % |
| Return on Equity (ttm) | 0 % |
| Qtrly Rev. Growth | -1 % |
| Gross Profit (p.s.) | 0 |
| Sales Per Share | 1.7 |
| EBITDA (p.s.) | -0.04 |
| Qtrly Earnings Growth | -66.6 % |
| Operating Cash Flow | -7 (M) |
| Levered Free Cash Flow | -34 (M) |
| PE Ratio | 0.31 |
| PEG Ratio | -17.5 |
| Price to Book value | 0.99 |
| Price to Sales | 2.62 |
| Price to Cash Flow | -64.66 |
| Dividend | 0 |
| Forward Dividend | 0 |
| Dividend Yield | 0% |
| Dividend Pay Date | Invalid DateTime. |
| Ex-Dividend Date | Invalid DateTime. |

|

|
|

|
|
|
|
|
|