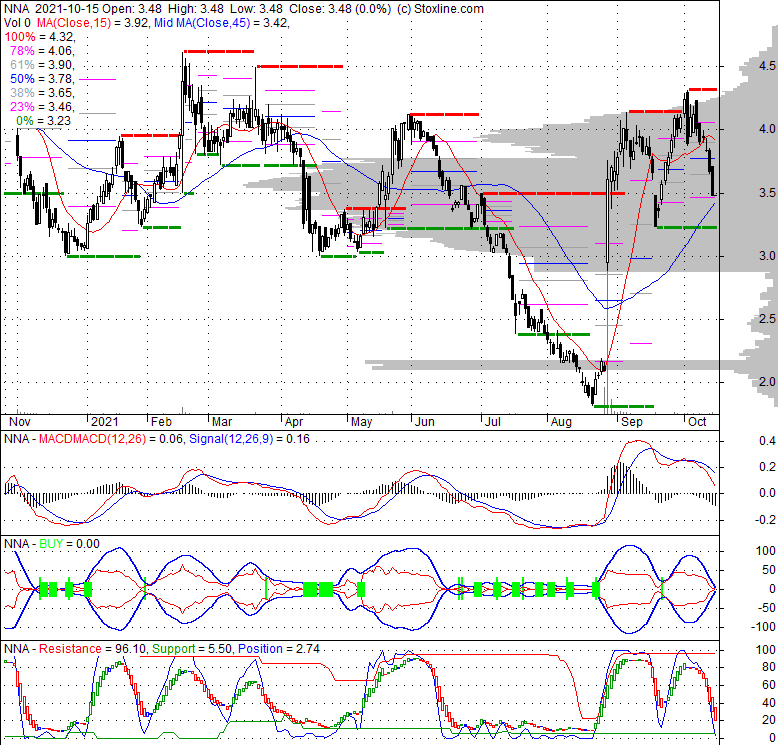
| 0 (0%) | 04-19 02:02 | |||||||||||||
|
|
| Short term | |
|||
| Mid term | |
|||
| Targets | 6-month : | 12.67 |
1-year : | 12.84 |
| Resists | First : | 10.85 |
Second : | 11 |
| Pivot price | 10.8 |
|||
| Supports | First : | 10.6 | Second : | 8.82 |
| MAs | MA(5) : | 10.68 |
MA(20) : | 10.83 |
| MA(100) : | 10.86 |
MA(250) : | 10.53 |
|
| MACD | MACD : | -0.1 |
Signal : | -0.1 |
| %K %D | K(14,3) : | 20.7 |
D(3) : | 14.1 |
| RSI | RSI(14): 30.8 |
|||
| 52-week | High : | 11.18 | Low : | 9.1 |
Price has closed below its short-term moving average. Short-term moving average is currently below mid-term; and below long-term moving average. From the relationship between price and moving averages: This stock is BEARISH in short-term; and NEUTRAL in mid-long term.[ NAN ] has closed above bottom band by 21.1%. Bollinger Bands are 14.1% wider than normal. The current width of the bands does not suggest anything about the future direction or movement of prices.
| If tomorrow: | Open lower | Open higher |
| High: | 10.73 - 10.79 | 10.79 - 10.86 |
| Low: | 10.5 - 10.56 | 10.56 - 10.64 |
| Close: | 10.55 - 10.67 | 10.67 - 10.8 |
Navios Maritime Acquisition Corp. engages in the marine transportation business. The firm owns a fleet of modern crude oil, refined petroleum product and chemical tankers providing marine transportation services around the world. The firm charters its vessels to international oil companies, refiners and vessel operators under long, medium and short-term charters. The firm's fleet includes approximately 38 double-hulled tanker vessels, aggregating approximately four million deadweight tons (dwt). The fleet includes approximately eight very large crude carrier (VLCC) tankers, which transport crude oil, and over eight Long Range 1 (LR1) product tankers; approximately 18 Medium Range 2 (MR2) product tankers, and over four chemical tankers, which transport refined petroleum products and bulk liquid chemicals. Its vessels include Nave Constellation, Nave Universe, Nave Polaris, Nave Cosmos, Nave Velocity, Nave Sextans, Nave Pyxis, Nave Luminosity, Nave Jupiter and Nave Pulsar.
Tue, 16 Apr 2024
NNA: One killed and two injured in the Israeli raid on Ain Baal - MTV Lebanon News
Fri, 12 Apr 2024
NNA: Israeli aircraft fly over Tyre and Bint Jbeil districts - LBCI Lebanon
Fri, 29 Mar 2024
Neuro-computing solution for Lorenz differential equations through artificial neural networks integrated with PSO-NNA ... - Nature.com
Sat, 23 Mar 2024
Happy birthday my gee @mclordellofficial more blessings nna - Instagram
Sun, 10 Mar 2024
‘Sureshinteyum Sumalathayudeyum Hridayahariyaya Pranayakatha’: First look of ‘Nna Thaan Case Kodu’ spin-off out - The Hindu
| Price to Book Value: P/BV, a ratio used to compare book value to its current market price, to gauge whether a stock is valued properly. |
Neutral |
| Price to Earnings: PE, the ratio for valuing a company that measures its current share price relative to its earnings per share (EPS). |
Outperform |
| Discounted cash flow: DCF, a valuation method used to estimate the value of an investment based on its expected future cash flows. |
Outperform |
| Return on Assets: ROA, indicates how profitable a company is in relation to its total assets, how efficiently uses assets to generate a profit. |
Neutral |
| Return on Equity: ROE, a measure of financial performance calculated by dividing net income by equity. a gauge of profitability and efficiency. |
Neutral |
| Debt to Equity: evaluate financial leverage, reflects the ability of equity to cover outstanding debts in the event of a business downturn. |
Outperform |

|
Exchange:
|
|
|
Sector:
Energy
|
|
|
Industry:
Oil & Gas Midstream
|
|
| Shares Out | 31 (M) |
| Shares Float | 0 (M) |
| Held by Insiders | 0 (%) |
| Held by Institutions | 24.4 (%) |
| Shares Short | 13 (K) |
| Shares Short P.Month | 16 (K) |
| EPS | -0.01 |
| EPS Est Next Qtrly | 0 |
| EPS Est This Year | 0 |
| EPS Est Next Year | 0 |
| Book Value (p.s.) | 12.14 |
| Profit Margin | -0.6 % |
| Operating Margin | 82.2 % |
| Return on Assets (ttm) | 2.1 % |
| Return on Equity (ttm) | -0.1 % |
| Qtrly Rev. Growth | 4.3 % |
| Gross Profit (p.s.) | 0 |
| Sales Per Share | 0.87 |
| EBITDA (p.s.) | 0 |
| Qtrly Earnings Growth | 0 % |
| Operating Cash Flow | 52 (M) |
| Levered Free Cash Flow | 18 (M) |
| PE Ratio | -1068 |
| PEG Ratio | 0 |
| Price to Book value | 0.87 |
| Price to Sales | 12.14 |
| Price to Cash Flow | 6.33 |
| Dividend | 0 |
| Forward Dividend | 0 |
| Dividend Yield | 0% |
| Dividend Pay Date | Invalid DateTime. |
| Ex-Dividend Date | Invalid DateTime. |