
| 504.61 -1.19 (-0.24%) | 09-29 16:00 | |||||||||||||
|
|
| Short term |  |
|||
| Mid term | |
|||
| Targets | 6-month : | 621.82  |
1-year : | 643.68 |
| Resists | First : | 532.38 |
Second : | 551.1 |
| Pivot price | 518.34 |
|||
| Supports | First : | 502.1 |
Second : | 417.74 |
| MAs | MA(5) : | 508.86 |
MA(20) : | 519.68 |
| MA(100) : | 537.1 |
MA(250) : | 590.76 |
|
| MACD | MACD : | -9.2 |
Signal : | -7.9 |
| %K %D | K(14,3) : | 9.4 |
D(3) : | 12.6 |
| RSI | RSI(14): 35 |
|||
| 52-week | High : | 767.11 | Low : | 476.85 |
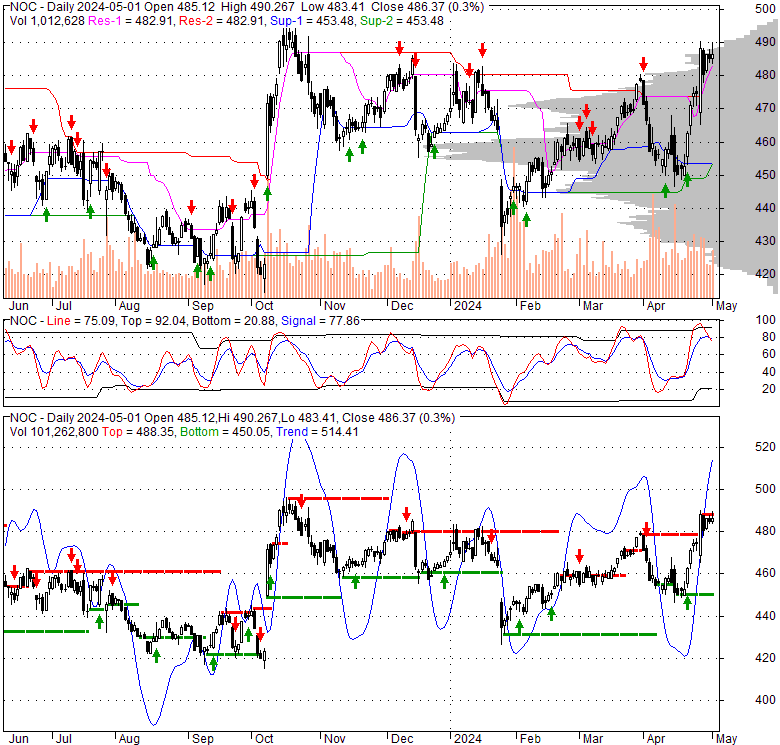
Price has closed below its short-term moving average. Short-term moving average is currently below mid-term; and below long-term moving average. From the relationship between price and moving averages: This stock is BEARISH in short-term; and NEUTRAL in mid-long term.[ NOC ] has closed above bottom band by 11.2%. Bollinger Bands are 33.1% narrower than normal. The current width of the bands does not suggest anything about the future direction or movement of prices.
| If tomorrow: | Open lower | Open higher |
| High: | 509.36 - 512.54 | 512.54 - 514.79 |
| Low: | 494.45 - 498.48 | 498.48 - 501.31 |
| Close: | 499.35 - 505.22 | 505.22 - 509.35 |
Northrop Grumman Corporation is a leading global player in the aerospace and defense sectors. Its Aeronautics Systems division is responsible for the full lifecycle of aircraft, from design and development to production, integration, and ongoing maintenance. This includes a diverse portfolio of crewed and uncrewed aerial platforms: advanced strategic long-range strike aircraft, tactical fighter and air superiority jets, and sophisticated airborne systems for battle management and command and control. Additionally, it specializes in autonomous uncrewed aircraft systems, such as high-altitude, long-endurance strategic intelligence, surveillance, and reconnaissance (ISR) platforms, alongside vertical take-off and landing tactical ISR systems. The Defense Systems segment focuses on creating and delivering a wide array of weapons and mission technologies. Its offerings encompass integrated battle management solutions, various weapons platforms, and specialized aircraft. Key products include command and control systems, munitions, and missiles, alongside precision strike capabilities. The segment is also at the forefront of propulsion technologies, offering both air-breathing and advanced hypersonic systems, as well as sophisticated gun systems and precision munitions. Beyond products, it provides comprehensive life-cycle support, including software services, ongoing maintenance, logistics, operational assistance, and modernization efforts for air, sea, and ground-based defense systems. Within its Mission Systems division, Northrop Grumman delivers critical capabilities spanning cybersecurity, C4ISR (command, control, communications, computers, intelligence, surveillance, and reconnaissance). This includes developing advanced sensing technologies such as radar, electro-optical/infrared, and acoustic sensors, alongside electronic warfare systems. The division also provides cutting-edge communications and networking solutions, intelligence processing, navigation systems, and maritime power, propulsion, and payload launch systems. Furthermore, it supplies airborne multifunction sensors, integrated maritime and land-based systems, targeting and survivability solutions, and robust networked information platforms. The Space Systems segment is a key provider of space-based solutions, delivering satellites and their associated payloads, along with essential ground control systems. It specializes in missile defense systems, including interceptors, and offers a range of launch vehicles with their propulsion components, as well as strategic missile technologies. Established in 1939, the corporation maintains its headquarters in Falls Church, Virginia.
Wed, 30 Sep 2026
Biggest stock movers Wednesday: BA, PYXS, NOC, and more (NOC:NYSE) - Seeking Alpha
Tue, 29 Sep 2026
Northrop Grumman to Accelerate Extended-Range C-UAS Missile Technology for US Army - Northrop Grumman
Mon, 28 Sep 2026
Northrop Grumman Will Do Well Even If Donald Trump's War Against Iran Ends (NYSE:NOC) - Seeking Alpha
Mon, 28 Sep 2026
Boeing vs. Northrop Grumman: Which Stock Offers Better Growth? - TradingView
Mon, 28 Sep 2026
Northrop Grumman Insiders Sell US$18m Of Stock, Possibly Signalling Caution - Moomoo
Mon, 28 Sep 2026
Northrop Grumman Advances Operational Capability for the PWSA With Delivery of 21 Satellites - Northrop Grumman
| Price to Book Value: P/BV, a ratio used to compare book value to its current market price, to gauge whether a stock is valued properly. |
Underperform |
| Price to Earnings: PE, the ratio for valuing a company that measures its current share price relative to its earnings per share (EPS). |
Neutral |
| Discounted cash flow: DCF, a valuation method used to estimate the value of an investment based on its expected future cash flows. |
Outperform |
| Return on Assets: ROA, indicates how profitable a company is in relation to its total assets, how efficiently uses assets to generate a profit. |
Outperform |
| Return on Equity: ROE, a measure of financial performance calculated by dividing net income by equity. a gauge of profitability and efficiency. |
Outperform |
| Debt to Equity: evaluate financial leverage, reflects the ability of equity to cover outstanding debts in the event of a business downturn. |
Underperform |
|
Exchange:
NYSE
|
|
|
Sector:
Industrials
|
|
|
Industry:
Aerospace & Defense
|
|
| Shares Out | 142 (M) |
| Shares Float | 142 (M) |
| Held by Insiders | 0.2 (%) |
| Held by Institutions | 84.4 (%) |
| Shares Short | 2,250 (K) |
| Shares Short P.Month | 2,450 (K) |
| EPS | 31.45 |
| EPS Est Next Qtrly | 0 |
| EPS Est This Year | 0 |
| EPS Est Next Year | 0 |
| Book Value (p.s.) | 125.88 |
| Profit Margin | 10.4 % |
| Operating Margin | 11.6 % |
| Return on Assets (ttm) | 7.1 % |
| Return on Equity (ttm) | 26.9 % |
| Qtrly Rev. Growth | 5 % |
| Gross Profit (p.s.) | 60.53 |
| Sales Per Share | 301.91 |
| EBITDA (p.s.) | 51.1 |
| Qtrly Earnings Growth | -5.9 % |
| Operating Cash Flow | 5,080 (M) |
| Levered Free Cash Flow | 2,480 (M) |
| PE Ratio | 16.04 |
| PEG Ratio | 3.3 |
| Price to Book value | 4 |
| Price to Sales | 1.67 |
| Price to Cash Flow | 14.11 |
| Dividend | 2.47 |
| Forward Dividend | 0 |
| Dividend Yield | 0.4% |
| Dividend Pay Date | Invalid DateTime. |
| Ex-Dividend Date | Invalid DateTime. |

|

|
|

|
|
|
|
|
|