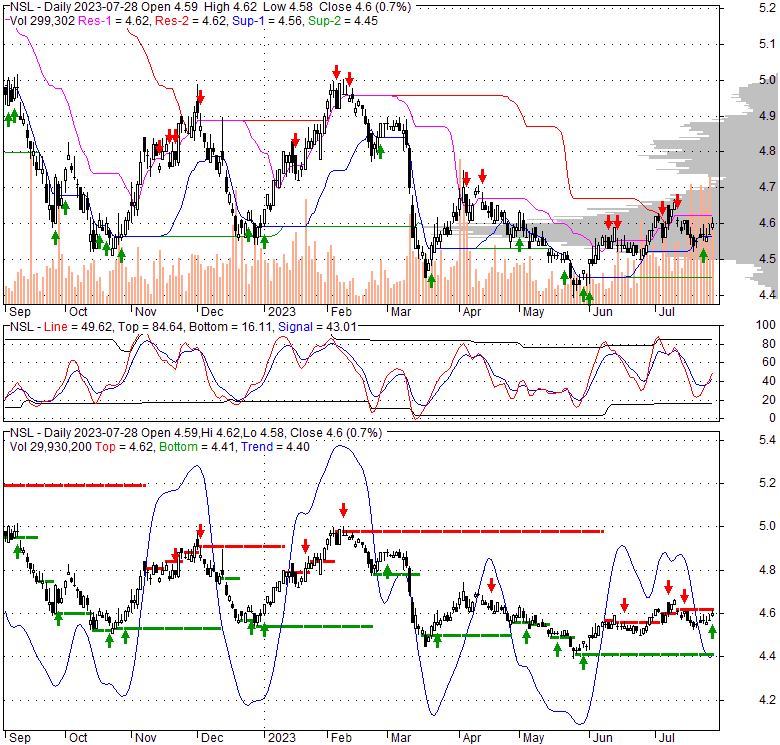
| 4.6 0.03 (0.66%) | 07-28 16:00 | |||||||||||||
|
|
| Short term | ||||
| Mid term | ||||
| Targets | 6-month : | 5.45 |
1-year : | 6.37 |
| Resists | First : | 4.67 |
Second : | 5.45 |
| Pivot price | 4.58 |
|||
| Supports | First : | 4.56 |
Second : | 4.5 |
| MAs | MA(5) : | 4.57 |
MA(20) : | 4.58 |
| MA(100) : | 4.57 |
MA(250) : | 4.72 |
|
| MACD | MACD : | 0 |
Signal : | 0 |
| %K %D | K(14,3) : | 37.7 |
D(3) : | 32.5 |
| RSI | RSI(14): 55.4 |
|||
| 52-week | High : | 5.21 | Low : | 4.38 |
Price has closed above its short-term moving average. Short-term moving average is currently above mid-term; and below long-term moving average. From the relationship between price and moving averages: This stock is BULLISH in short-term; and NEUTRAL in mid-long term.[ NSL ] has closed below upper band by 38.8%. Bollinger Bands are 33.4% narrower than normal. The current width of the bands does not suggest anything about the future direction or movement of prices.
| If tomorrow: | Open lower | Open higher |
| High: | 4.63 - 4.64 | 4.64 - 4.66 |
| Low: | 4.53 - 4.55 | 4.55 - 4.57 |
| Close: | 4.57 - 4.6 | 4.6 - 4.63 |
Nuveen Senior Income Fund is a closed ended fixed income mutual fund launched by Nuveen Investments, Inc. It is managed by Symphony Asset Management LLC. The fund invests in fixed income markets of the United States. It primarily invests in adjustable rate U.S dollar-denominated secured Senior Loans. Nuveen Senior Income Fund was formed on October 26, 1999 and is domiciled in the United States.
Wed, 12 Jan 2022
6 Funds That Look Like Winning Income Plays for Another Year - Barron's
Wed, 13 Jan 2021
How to Play Bond King Jeffrey Gundlach’s Favorite Income Pick for 2021 - Barron's
Thu, 02 May 2019
Closed-End Fund Ratings - Forbes
| Price to Book Value: P/BV, a ratio used to compare book value to its current market price, to gauge whether a stock is valued properly. |
Neutral |
| Price to Earnings: PE, the ratio for valuing a company that measures its current share price relative to its earnings per share (EPS). |
Neutral |
| Discounted cash flow: DCF, a valuation method used to estimate the value of an investment based on its expected future cash flows. |
Neutral |
| Return on Assets: ROA, indicates how profitable a company is in relation to its total assets, how efficiently uses assets to generate a profit. |
Neutral |
| Return on Equity: ROE, a measure of financial performance calculated by dividing net income by equity. a gauge of profitability and efficiency. |
Neutral |
| Debt to Equity: evaluate financial leverage, reflects the ability of equity to cover outstanding debts in the event of a business downturn. |
Neutral |
|
Exchange:
NYSE
|
|
|
Sector:
Financial Services
|
|
|
Industry:
Asset Management - Income
|
|
| Shares Out | 0 (M) |
| Shares Float | 0 (M) |
| Held by Insiders | 0 (%) |
| Held by Institutions | 0 (%) |
| Shares Short | 0 (K) |
| Shares Short P.Month | 0 (K) |
| EPS | 0 |
| EPS Est Next Qtrly | 0 |
| EPS Est This Year | 0 |
| EPS Est Next Year | 0 |
| Book Value (p.s.) | 0 |
| Profit Margin | 0 % |
| Operating Margin | 0 % |
| Return on Assets (ttm) | 0 % |
| Return on Equity (ttm) | 0 % |
| Qtrly Rev. Growth | 0 % |
| Gross Profit (p.s.) | 0.46 |
| Sales Per Share | 0.59 |
| EBITDA (p.s.) | 0 |
| Qtrly Earnings Growth | 0 % |
| Operating Cash Flow | 0 (M) |
| Levered Free Cash Flow | 0 (M) |
| PE Ratio | 0 |
| PEG Ratio | 0 |
| Price to Book value | 0 |
| Price to Sales | 7.69 |
| Price to Cash Flow | 0 |
| Dividend | 0 |
| Forward Dividend | 0 |
| Dividend Yield | 0% |
| Dividend Pay Date | Invalid DateTime. |
| Ex-Dividend Date | Invalid DateTime. |

|

|
|

|
|
|
|
|
|