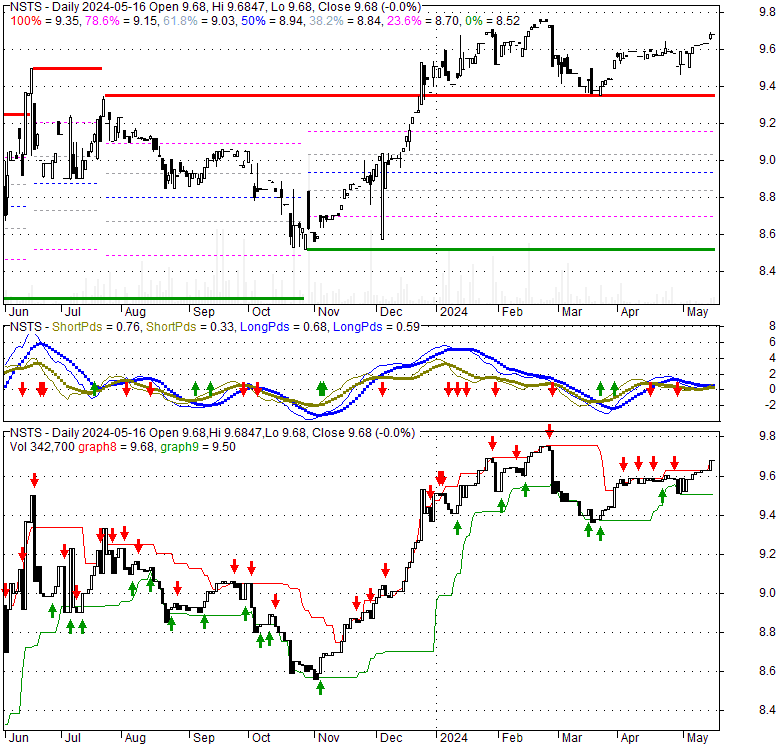
| 9.52 -0.07 (-0.73%) | 05-01 16:00 | |||||||||||||
|
|
| Short term | |
|||
| Mid term | ||||
| Targets | 6-month : | 11.17 |
1-year : | 11.27 |
| Resists | First : | 9.56 |
Second : | 9.64 |
| Pivot price | 9.57 |
|||
| Supports | First : | 9.43 |
Second : | 7.85 |
| MAs | MA(5) : | 9.55 |
MA(20) : | 9.57 |
| MA(100) : | 9.49 |
MA(250) : | 9.14 |
|
| MACD | MACD : | 0 |
Signal : | 0 |
| %K %D | K(14,3) : | 21.4 |
D(3) : | 26.6 |
| RSI | RSI(14): 45.3 |
|||
| 52-week | High : | 9.76 | Low : | 8.25 |
Price has closed below its short-term moving average. Short-term moving average is currently above mid-term; and above long-term moving average. From the relationship between price and moving averages: This stock is NEUTRAL in short-term; and BULLISH in mid-long term.[ NSTS ] has closed below the lower bollinger band by 2.9%. Although price has broken the lower band and a downside breakout is possible; the most likely direction for [ NSTS ] is to continue within current trading range. It is unclear right now based on current values. 66% narrower than normal. The narrow width of the bands suggests low volatility as compared to its normal range. The bands have been in this narrow range for 11 bars. This is a sign that the market may be about to initiate a new trend.
| If tomorrow: | Open lower | Open higher |
| High: | 9.6 - 9.66 | 9.66 - 9.71 |
| Low: | 9.38 - 9.45 | 9.45 - 9.51 |
| Close: | 9.49 - 9.59 | 9.59 - 9.68 |
NSTS Bancorp, Inc. operates as a savings and loan holding company for North Shore Trust and Savings that provides banking products and services in Illinois. The company offers checking, money market, savings, and time deposit accounts; and one- to four-family residential mortgage, multi-family and commercial real estate, construction, home equity, and consumer loans. It operates through a main banking office in Waukegan, Illinois; and two full-service branch offices located in Waukegan and Lindenhurst, Illinois, as well as a loan production office in Chicago, Illinois. The company was founded in 1921 and is headquartered in Waukegan, Illinois.
Mon, 29 Apr 2024
NSTS Bancorp, Inc. (NASDAQ:NSTS) Sees Significant Decrease in Short Interest - MarketBeat
Sat, 27 Apr 2024
(NSTS) Pivots Trading Plans and Risk Controls - Stock Traders Daily
Mon, 22 Apr 2024
Emily Ansani Joins NSTS Bancorp as New Director - TipRanks.com - TipRanks
Thu, 04 Apr 2024
NSTS Bancorp (NASDAQ:NSTS) Trading Down 0.3% - MarketBeat
Fri, 26 Jan 2024
Bus driver hits truck while 4 students still on board, drives off with only 3 wheels, Niagara police say - CBC.ca
Thu, 09 Nov 2023
State of the Pipeline – as of Nov. 8, 2023 - S&P Global
| Price to Book Value: P/BV, a ratio used to compare book value to its current market price, to gauge whether a stock is valued properly. |
Underperform |
| Price to Earnings: PE, the ratio for valuing a company that measures its current share price relative to its earnings per share (EPS). |
Underperform |
| Discounted cash flow: DCF, a valuation method used to estimate the value of an investment based on its expected future cash flows. |
Neutral |
| Return on Assets: ROA, indicates how profitable a company is in relation to its total assets, how efficiently uses assets to generate a profit. |
Underperform |
| Return on Equity: ROE, a measure of financial performance calculated by dividing net income by equity. a gauge of profitability and efficiency. |
Underperform |
| Debt to Equity: evaluate financial leverage, reflects the ability of equity to cover outstanding debts in the event of a business downturn. |
Underperform |

|
Exchange:
NASDAQ
|
|
|
Sector:
Financial Services
|
|
|
Industry:
Banks - Regional
|
|
| Shares Out | 0 (M) |
| Shares Float | 5 (M) |
| Held by Insiders | 4.92e+006 (%) |
| Held by Institutions | 16.1 (%) |
| Shares Short | 6 (K) |
| Shares Short P.Month | 0 (K) |
| EPS | 0 |
| EPS Est Next Qtrly | 0 |
| EPS Est This Year | 0 |
| EPS Est Next Year | 0 |
| Book Value (p.s.) | 0 |
| Profit Margin | -80.9 % |
| Operating Margin | 1 % |
| Return on Assets (ttm) | 161.7 % |
| Return on Equity (ttm) | -1.6 % |
| Qtrly Rev. Growth | 4.89e+006 % |
| Gross Profit (p.s.) | 0 |
| Sales Per Share | -55.67 |
| EBITDA (p.s.) | 0 |
| Qtrly Earnings Growth | -0.8 % |
| Operating Cash Flow | 0 (M) |
| Levered Free Cash Flow | 0 (M) |
| PE Ratio | 0 |
| PEG Ratio | 0 |
| Price to Book value | 0 |
| Price to Sales | -0.18 |
| Price to Cash Flow | 0.05 |
| Dividend | 0 |
| Forward Dividend | 4490 |
| Dividend Yield | 0% |
| Dividend Pay Date | Invalid DateTime. |
| Ex-Dividend Date | Invalid DateTime. |