| 0 (0%) | 04-25 05:14 | |||||||||||||
|
|
| Short term | |
|||
| Mid term | |
|||
| Targets | 6-month : | 2.94 | 1-year : | 3.43 |
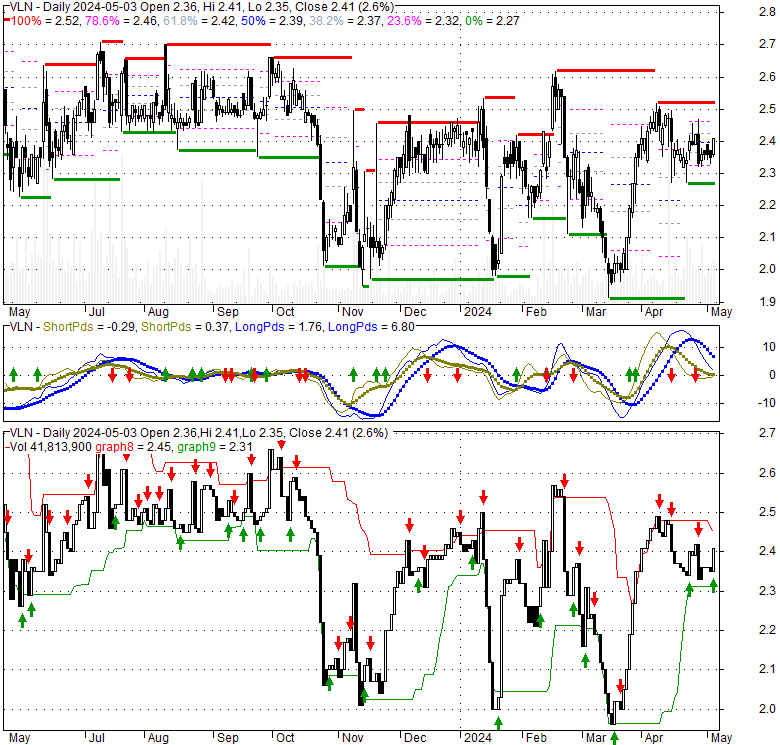
| Resists | First : | 2.51 | Second : | 2.94 |
| Pivot price | 2.41 |
|||
| Supports | First : | 2.17 | Second : | 1.96 |
| MAs | MA(5) : | 2.36 |
MA(20) : | 2.4 |
| MA(100) : | 2.31 |
MA(250) : | 2.38 |
|
| MACD | MACD : | 0 |
Signal : | 0 |
| %K %D | K(14,3) : | 42.6 |
D(3) : | 37.3 |
| RSI | RSI(14): 54.8 |
|||
| 52-week | High : | 2.79 | Low : | 1.9 |
Price has closed above its short-term moving average. Short-term moving average is currently above mid-term; and above long-term moving average. From the relationship between price and moving averages: This stock is BULLISH in short-term; and NEUTRAL in mid-long term.[ VLN ] has closed above bottom band by 37.2%. Bollinger Bands are 50.6% narrower than normal. The narrow width of the bands suggests low volatility as compared to its normal range. The bands have been in this narrow range for 6 bars. This is a sign that the market may be about to initiate a new trend.
| If tomorrow: | Open lower | Open higher |
| High: | 2.47 - 2.48 | 2.48 - 2.49 |
| Low: | 2.34 - 2.36 | 2.36 - 2.38 |
| Close: | 2.36 - 2.39 | 2.39 - 2.41 |
Fri, 10 Mar 2023
Novelion Announces Completion of Plan of Liquidation and Distribution and its Voluntary Dissolution - GlobeNewswire
Mon, 28 Mar 2022
Novelion Announces Date of Final Distribution to Registered Shareholders - GlobeNewswire
Wed, 30 Sep 2020
Novelion Therapeutics Provides Update on Liquidation Process - GlobeNewswire
Wed, 25 Sep 2019
Novelion Therapeutics Announces Completion of Aegerion Transaction and Departure of Certain Directors and Officers - GlobeNewswire
Mon, 20 May 2019
Novelion Therapeutics Announces Subsidiary Aegerion Pharmaceuticals to Recapitalize Through Court Supervised ... - GlobeNewswire
Tue, 20 Nov 2018
Novelion Therapeutics Announces Leadership Change - GlobeNewswire
| Price to Book Value: P/BV, a ratio used to compare book value to its current market price, to gauge whether a stock is valued properly. |
Neutral |
| Price to Earnings: PE, the ratio for valuing a company that measures its current share price relative to its earnings per share (EPS). |
Neutral |
| Discounted cash flow: DCF, a valuation method used to estimate the value of an investment based on its expected future cash flows. |
Neutral |
| Return on Assets: ROA, indicates how profitable a company is in relation to its total assets, how efficiently uses assets to generate a profit. |
Neutral |
| Return on Equity: ROE, a measure of financial performance calculated by dividing net income by equity. a gauge of profitability and efficiency. |
Neutral |
| Debt to Equity: evaluate financial leverage, reflects the ability of equity to cover outstanding debts in the event of a business downturn. |
Neutral |
|
Exchange:
|
|
|
Sector:
|
|
|
Industry:
|
|
| Shares Out | 105 (M) |
| Shares Float | 68 (M) |
| Held by Insiders | 10.1 (%) |
| Held by Institutions | 39.2 (%) |
| Shares Short | 230 (K) |
| Shares Short P.Month | 158 (K) |
| EPS | -0.19 |
| EPS Est Next Qtrly | 0 |
| EPS Est This Year | 0 |
| EPS Est Next Year | 0 |
| Book Value (p.s.) | 1.59 |
| Profit Margin | -23.4 % |
| Operating Margin | -8 % |
| Return on Assets (ttm) | -9 % |
| Return on Equity (ttm) | -11.9 % |
| Qtrly Rev. Growth | -6.5 % |
| Gross Profit (p.s.) | 0 |
| Sales Per Share | 0.79 |
| EBITDA (p.s.) | -0.25 |
| Qtrly Earnings Growth | 0 % |
| Operating Cash Flow | -6 (M) |
| Levered Free Cash Flow | -3 (M) |
| PE Ratio | -12.58 |
| PEG Ratio | -1.8 |
| Price to Book value | 1.5 |
| Price to Sales | 2.98 |
| Price to Cash Flow | -39.54 |
| Dividend | 0 |
| Forward Dividend | 0 |
| Dividend Yield | 0% |
| Dividend Pay Date | Invalid DateTime. |
| Ex-Dividend Date | Invalid DateTime. |

|

|
|

|
|
|
|
|
|