| 9.995 -0.005 (-0.05%) | 12-31 19:00 | |||||||||||||
|
|
| Short term | |
|||
| Mid term | |
|||
| Targets | 6-month : | 11.68 | 1-year : | 13.64 |
| Resists | First : | 10 | Second : | 11.68 |
| Pivot price | 9.99 | |||
| Supports | First : | 9.99 | Second : | 9.98 |
| MAs | MA(5) : | 9.99 | MA(20) : | 9.99 |
| MA(100) : | 9.99 | MA(250) : | 9.97 |
|
| MACD | MACD : | 0 |
Signal : | 0 |
| %K %D | K(14,3) : | 50 | D(3) : | 50 |
| RSI | RSI(14): 58.4 | |||
| 52-week | High : | 10 | Low : | 9.86 |
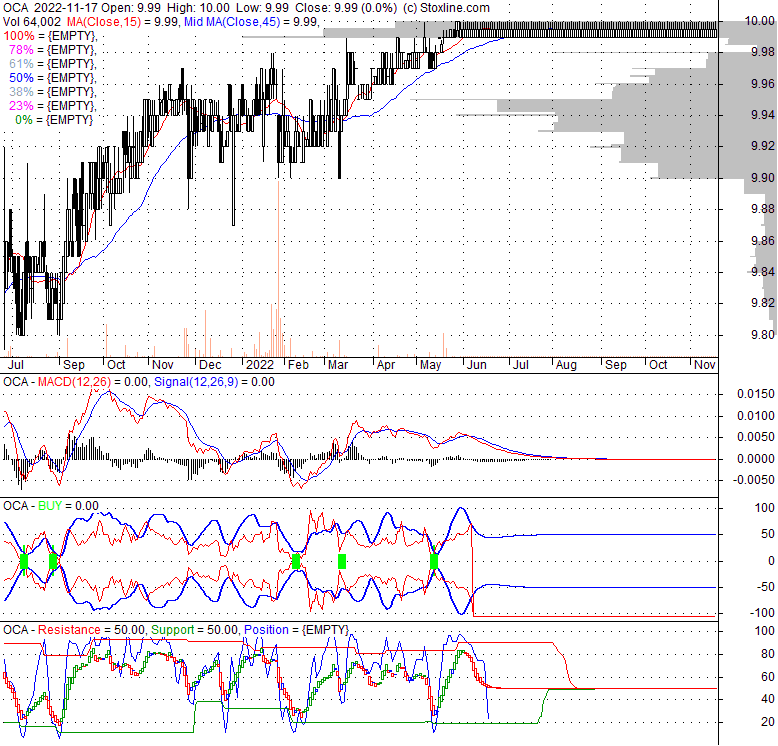
Price has closed below its short-term moving average. Short-term moving average is currently below mid-term; and below long-term moving average. From the relationship between price and moving averages: This stock is NEUTRAL in short-term; and NEUTRAL in mid-long term.[ OCA ] has closed Bollinger Bands are 0% narrower than normal.
| If tomorrow: | Open lower | Open higher |
| High: | 10.02 - 10.07 | 10.07 - 10.11 |
| Low: | 9.85 - 9.92 | 9.92 - 9.97 |
| Close: | 9.9 - 10 | 10 - 10.09 |
Omnichannel Acquisition Corp. does not have significant operations. It intends to effect a merger, capital stock exchange, asset acquisition, stock purchase, reorganization, or other business combination with one or more businesses. The company intends to focus on 'omnichannel' businesses, such as technology-enabled cross-channel retail and consumer services, including the direct-to-consumer/e-commerce retail, consumer healthcare, consumer marketplaces, consumer services, and related sectors. Omnichannel Acquisition Corp. was incorporated in 2020 and is based in Millburn, New Jersey.
Wed, 26 Jan 2022
Chamath Gets 2nd Deal of 2022 and SPAC IPO Market Shows Signs of Closing - TheStreet
Tue, 25 Jan 2022
Jimmy Chill Sick on SPACs. High Redemptions Continue. - TheStreet
Thu, 20 Jan 2022
Kin Insurance Exceeds 2021 Goal for Total Managed Premium, Achieves 320% Year-Over-Year Growth - Business Wire
Tue, 11 Jan 2022
SPACs Bounce. Ex-Redemption Pain. And, Still no Deals - TheStreet
Wed, 10 Nov 2021
Kin Insurance Sees Growth Accelerate at the Start of Fourth Quarter 2021, While Adjusted Loss Ratio Improves - Business Wire
Fri, 10 Sep 2021
Kin Insurance Grows Total Written Premium by 287% Year-Over-Year in Second Quarter 2021 - Business Wire
| Price to Book Value: P/BV, a ratio used to compare book value to its current market price, to gauge whether a stock is valued properly. |
Underperform |
| Price to Earnings: PE, the ratio for valuing a company that measures its current share price relative to its earnings per share (EPS). |
Outperform |
| Discounted cash flow: DCF, a valuation method used to estimate the value of an investment based on its expected future cash flows. |
Outperform |
| Return on Assets: ROA, indicates how profitable a company is in relation to its total assets, how efficiently uses assets to generate a profit. |
Neutral |
| Return on Equity: ROE, a measure of financial performance calculated by dividing net income by equity. a gauge of profitability and efficiency. |
Underperform |
| Debt to Equity: evaluate financial leverage, reflects the ability of equity to cover outstanding debts in the event of a business downturn. |
Underperform |
|
Exchange:
NYSE
|
|
|
Sector:
Financial Services
|
|
|
Industry:
Shell Companies
|
|
| Shares Out | 21 (M) |
| Shares Float | 16 (M) |
| Held by Insiders | 0 (%) |
| Held by Institutions | 107.1 (%) |
| Shares Short | 2 (K) |
| Shares Short P.Month | 2 (K) |
| EPS | -0.16 |
| EPS Est Next Qtrly | 0 |
| EPS Est This Year | 0 |
| EPS Est Next Year | 0 |
| Book Value (p.s.) | -0.94 |
| Profit Margin | 0 % |
| Operating Margin | 0 % |
| Return on Assets (ttm) | -1.5 % |
| Return on Equity (ttm) | 0 % |
| Qtrly Rev. Growth | 0 % |
| Gross Profit (p.s.) | 0 |
| Sales Per Share | 0 |
| EBITDA (p.s.) | 0 |
| Qtrly Earnings Growth | 0 % |
| Operating Cash Flow | -1 (M) |
| Levered Free Cash Flow | 0 (M) |
| PE Ratio | -66.64 |
| PEG Ratio | 0 |
| Price to Book value | -10.75 |
| Price to Sales | 0 |
| Price to Cash Flow | -151.77 |
| Dividend | 0 |
| Forward Dividend | 0 |
| Dividend Yield | 0% |
| Dividend Pay Date | Invalid DateTime. |
| Ex-Dividend Date | Invalid DateTime. |

|

|
|

|
|
|
|
|
|