| 24.0443 -0.001 (-0%) | 04-26 15:48 | |||||||||||||
|
|
| Short term | |
|||
| Mid term | ||||
| Targets | 6-month : | 28.23 |
1-year : | 28.41 |
| Resists | First : | 24.17 |
Second : | 24.32 |
| Pivot price | 24 |
|||
| Supports | First : | 23.92 | Second : | 19.9 |
| MAs | MA(5) : | 24.03 |
MA(20) : | 23.99 |
| MA(100) : | 24.14 |
MA(250) : | 0 | |
| MACD | MACD : | -0.1 |
Signal : | -0.1 |
| %K %D | K(14,3) : | 65.6 |
D(3) : | 64.5 |
| RSI | RSI(14): 49.3 |
|||
| 52-week | High : | 24.44 | Low : | 23.69 |
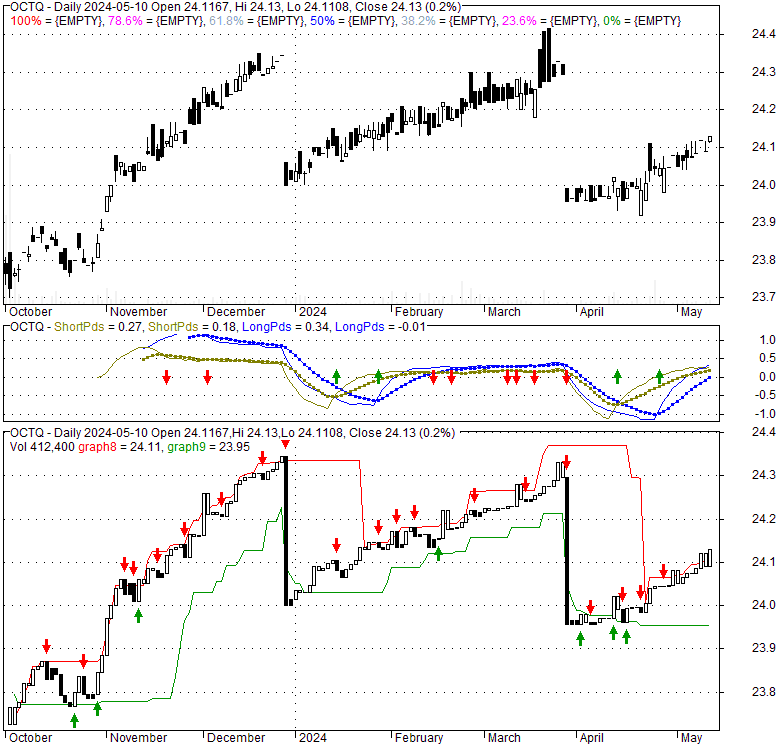
Price has closed above its short-term moving average. Short-term moving average is currently below mid-term; and below long-term moving average. From the relationship between price and moving averages: This stock is NEUTRAL in short-term; and BEARISH in mid-long term.[ OCTQ ] has closed below upper band by 11.9%. Bollinger Bands are 49.8% narrower than normal. The narrow width of the bands suggests low volatility as compared to its normal range. The bands have been in this narrow range for 7 bars. This is a sign that the market may be about to initiate a new trend.
| If tomorrow: | Open lower | Open higher |
| High: | 24.1 - 24.24 | 24.24 - 24.35 |
| Low: | 23.65 - 23.82 | 23.82 - 23.96 |
| Close: | 23.79 - 24.05 | 24.05 - 24.26 |
The fund is an actively managed exchange-traded fund (“ETF”) that invests in U.S. Treasury bills and FLexible EXchange® Options that use as a reference asset a broad-based U.S. equity index, specifically the S&P 500® Price Return Index. The fund is non-diversified.
| Price to Book Value: P/BV, a ratio used to compare book value to its current market price, to gauge whether a stock is valued properly. |
Neutral |
| Price to Earnings: PE, the ratio for valuing a company that measures its current share price relative to its earnings per share (EPS). |
Neutral |
| Discounted cash flow: DCF, a valuation method used to estimate the value of an investment based on its expected future cash flows. |
Neutral |
| Return on Assets: ROA, indicates how profitable a company is in relation to its total assets, how efficiently uses assets to generate a profit. |
Neutral |
| Return on Equity: ROE, a measure of financial performance calculated by dividing net income by equity. a gauge of profitability and efficiency. |
Neutral |
| Debt to Equity: evaluate financial leverage, reflects the ability of equity to cover outstanding debts in the event of a business downturn. |
Neutral |
|
Exchange:
ETF
|
|
|
Sector:
Financial Services
|
|
|
Industry:
Asset Management - Income
|
|
| Shares Out | 0 (M) |
| Shares Float | 0 (M) |
| Held by Insiders | 0 (%) |
| Held by Institutions | 0 (%) |
| Shares Short | 0 (K) |
| Shares Short P.Month | 0 (K) |
| EPS | 0 |
| EPS Est Next Qtrly | 0 |
| EPS Est This Year | 0 |
| EPS Est Next Year | 0 |
| Book Value (p.s.) | 0 |
| Profit Margin | 0 % |
| Operating Margin | 0 % |
| Return on Assets (ttm) | 0 % |
| Return on Equity (ttm) | 0 % |
| Qtrly Rev. Growth | 0 % |
| Gross Profit (p.s.) | 0 |
| Sales Per Share | 0 |
| EBITDA (p.s.) | 0 |
| Qtrly Earnings Growth | 0 % |
| Operating Cash Flow | 0 (M) |
| Levered Free Cash Flow | 0 (M) |
| PE Ratio | 0 |
| PEG Ratio | 0 |
| Price to Book value | 0 |
| Price to Sales | 0 |
| Price to Cash Flow | 0 |
| Dividend | 0 |
| Forward Dividend | 0 |
| Dividend Yield | 0% |
| Dividend Pay Date | Invalid DateTime. |
| Ex-Dividend Date | Invalid DateTime. |

|

|
|

|
|
|
|
|
|