
| 1.12 -0.05 (-4.27%) | 04-24 15:47 | |||||||||||||
|
|
| Short term |  |
|||
| Mid term | |
|||
| Targets | 6-month : | 1-year : | ||
| Resists | First : | Second : | ||
| Pivot price | ||||
| Supports | First : | Second : | ||
| MAs | MA(5) : | MA(20) : | ||
| MA(100) : | MA(250) : | |||
| MACD | MACD : | Signal : | ||
| %K %D | K(14,3) : | D(3) : | ||
| RSI | RSI(14): | |||
| 52-week | High : | Low : | ||
| If tomorrow: | Open lower | Open higher |
| High: | - | - |
| Low: | - | - |
| Close: | - | - |
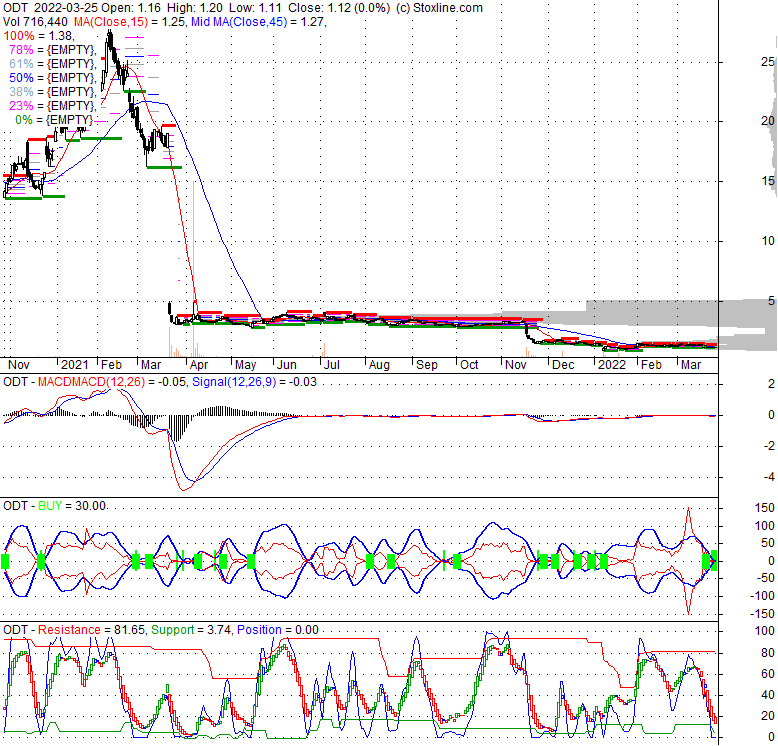
Odonate Therapeutics, Inc. functions as a pharmaceutical enterprise, dedicating its efforts to the creation of innovative therapeutic agents for cancer treatment. A prominent compound within its development pipeline is tesetaxel, an orally administered chemotherapy drug. This agent is currently advancing through Phase III clinical trials, specifically under investigation for its application in individuals with metastatic breast cancer. Established in 2013, the company's operations are headquartered in New York, New York.
Wed, 17 Nov 2021
Odonate Therapeutics Announces Planned Return of Capital to Stockholders through Share Repurchase Plan - Business Wire
Tue, 27 Jul 2021
Odonate Therapeutics Announces Financial Results for the Three and Six Months Ended June 30, 2021 - Business Wire
Mon, 22 Mar 2021
Odonate Therapeutics Announces Discontinuation of Development of Tesetaxel - Business Wire
Tue, 03 Nov 2020
ODT, NNOX & GOCO Class Actions: Bronstein, Gewirtz & - GlobeNewswire
Mon, 01 Oct 2018
Nearly 100 California companies have no women on their board of directors - CBS News
Fri, 24 Nov 2017
IPO News - US IPO Week Ahead: IPOs ready to launch in final stretch of 2017 - renaissancecapital.com
| Price to Book Value: P/BV, a ratio used to compare book value to its current market price, to gauge whether a stock is valued properly. |
Outperform |
| Price to Earnings: PE, the ratio for valuing a company that measures its current share price relative to its earnings per share (EPS). |
Underperform |
| Discounted cash flow: DCF, a valuation method used to estimate the value of an investment based on its expected future cash flows. |
Outperform |
| Return on Assets: ROA, indicates how profitable a company is in relation to its total assets, how efficiently uses assets to generate a profit. |
Underperform |
| Return on Equity: ROE, a measure of financial performance calculated by dividing net income by equity. a gauge of profitability and efficiency. |
Underperform |
| Debt to Equity: evaluate financial leverage, reflects the ability of equity to cover outstanding debts in the event of a business downturn. |
Neutral |
|
Exchange:
NASDAQ
|
|
|
Sector:
Healthcare
|
|
|
Industry:
Biotechnology
|
|
| Shares Out | 0 (M) |
| Shares Float | 0 (M) |
| Held by Insiders | (%) |
| Held by Institutions | (%) |
| Shares Short | 0 (K) |
| Shares Short P.Month | 0 (K) |
| EPS | |
| EPS Est Next Qtrly | |
| EPS Est This Year | |
| EPS Est Next Year | |
| Book Value (p.s.) | |
| Profit Margin | % |
| Operating Margin | % |
| Return on Assets (ttm) | % |
| Return on Equity (ttm) | % |
| Qtrly Rev. Growth | % |
| Gross Profit (p.s.) | |
| Sales Per Share | |
| EBITDA (p.s.) | |
| Qtrly Earnings Growth | % |
| Operating Cash Flow | 0 (M) |
| Levered Free Cash Flow | 0 (M) |
| PE Ratio | |
| PEG Ratio | |
| Price to Book value | |
| Price to Sales | |
| Price to Cash Flow |
| Dividend | |
| Forward Dividend | |
| Dividend Yield | 0% |
| Dividend Pay Date | |
| Ex-Dividend Date |

|

|

|

|
|
|
|
|
|