
| 88.87 -1.26 (-1.4%) | 10-19 16:00 | |||||||||||||
|
|
| Short term |   |
|||
| Mid term |  |
|||
| Targets | 6-month : | 106.14 | 1-year : | 123.98 |
| Resists | First : | 90.87 | Second : | 106.14 |
| Pivot price | 88.76  |
|||
| Supports | First : | 88.25 | Second : | 86.63 |
| MAs | MA(5) : | 89.41 |
MA(20) : | 88.84 |
| MA(100) : | 89.45 |
MA(250) : | 86.24 |
|
| MACD | MACD : | -0.1 |
Signal : | -0.3 |
| %K %D | K(14,3) : | 69.4 |
D(3) : | 71 |
| RSI | RSI(14): 49.1 |
|||
| 52-week | High : | 94.49 | Low : | 72.28 |
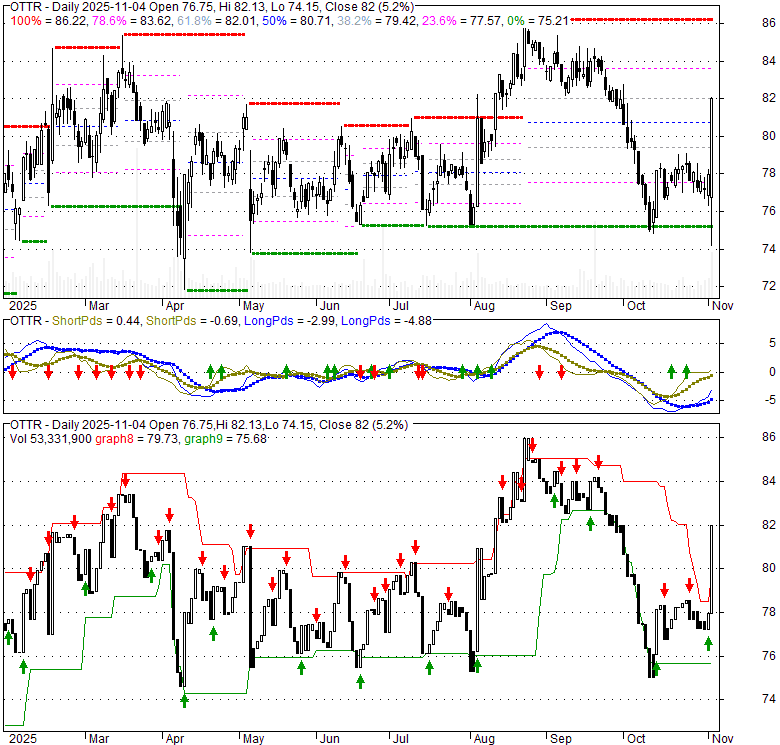
Price has closed below its short-term moving average. Short-term moving average is currently below mid-term; and below long-term moving average. From the relationship between price and moving averages: This stock is BEARISH in short-term; and NEUTRAL in mid-long term.[ OTTR ] has closed below upper band by 46.0%. Bollinger Bands are 42.4% narrower than normal. The narrow width of the bands suggests low volatility as compared to its normal range. The bands have been in this narrow range for 13 bars. This is a sign that the market may be about to initiate a new trend.
| If tomorrow: | Open lower | Open higher |
| High: | 90.34 - 90.8 | 90.8 - 91.09 |
| Low: | 87.46 - 88.07 | 88.07 - 88.46 |
| Close: | 88 - 88.92 | 88.92 - 89.5 |
Otter Tail Corporation, an entity founded in 1907 and based in Fergus Falls, Minnesota, is a diversified enterprise conducting business in the United States across three primary sectors: an electric utility, manufacturing operations, and the production of plastic pipes. The company adopted its current name in 2001, having previously been known as Otter Tail Power Company. The Electric segment is responsible for generating, transmitting, distributing, and selling electricity. It serves approximately 133,000 residential, industrial, and commercial customers across Minnesota, North Dakota, and South Dakota. This segment draws its power from a mix of sources including coal, wind, hydroelectric, and natural gas, and actively participates in the Midcontinent Independent System Operator, Inc. (MISO) markets. Through its Manufacturing segment, the company offers services such as contract machining, metal parts stamping, fabrication, and painting. It also produces specialized plastic thermoformed products, including containers for horticultural purposes, packaging solutions for the life sciences and industrial sectors, and components for material handling. These products cater to a wide array of industries, such as recreational vehicles, agriculture, construction, lawn and garden, and industrial and energy equipment. Additionally, this segment manufactures custom packaging like clamshells, blister packs, and returnable trays, designed to transport and store unusually shaped or delicate parts for clients in the horticulture, medical, industrial, recreation, and electronics fields. Finally, the Plastics segment focuses on manufacturing polyvinyl chloride (PVC) pipes. These pipes are essential for various water management applications, including municipal water supply, rural water systems, wastewater treatment, storm drainage, and water reclamation projects. The products from this segment are sold to wholesalers and distributors through a combination of independent sales representatives, internal sales personnel, and dedicated customer service teams.
Sat, 17 Oct 2026
Otter Tail stock sits 4.8 percent above its USD 86.00 target - ad-hoc-news.de
Sat, 17 Oct 2026
Otter Tail Corporation (OTTR) Stock Forecasts - Yahoo Finance
Thu, 15 Oct 2026
Otter Tail Corporation (OTTR) Stock Forecasts - Yahoo Finance
Wed, 14 Oct 2026
S&P revises Otter Tail outlook to stable on capex growth and PVC segment softening - Yahoo Finance
Tue, 13 Oct 2026
Press Release: Otter Tail Corporation Will Host Conference Call on Third Quarter 2026 Financial Results - Moomoo
Tue, 13 Oct 2026
Otter Tail Corporation Will Host Conference Call on Third Quarter 2026 Financial Results - Yahoo Finance
| Price to Book Value: P/BV, a ratio used to compare book value to its current market price, to gauge whether a stock is valued properly. |
Neutral |
| Price to Earnings: PE, the ratio for valuing a company that measures its current share price relative to its earnings per share (EPS). |
Neutral |
| Discounted cash flow: DCF, a valuation method used to estimate the value of an investment based on its expected future cash flows. |
Outperform |
| Return on Assets: ROA, indicates how profitable a company is in relation to its total assets, how efficiently uses assets to generate a profit. |
Neutral |
| Return on Equity: ROE, a measure of financial performance calculated by dividing net income by equity. a gauge of profitability and efficiency. |
Neutral |
| Debt to Equity: evaluate financial leverage, reflects the ability of equity to cover outstanding debts in the event of a business downturn. |
Underperform |
|
Exchange:
NASDAQ
|
|
|
Sector:
Industrials
|
|
|
Industry:
Conglomerates
|
|
| Shares Out | 42 (M) |
| Shares Float | 41 (M) |
| Held by Insiders | 2 (%) |
| Held by Institutions | 78.9 (%) |
| Shares Short | 4,810 (K) |
| Shares Short P.Month | 4,810 (K) |
| EPS | 4.59 |
| EPS Est Next Qtrly | 0 |
| EPS Est This Year | 0 |
| EPS Est Next Year | 0 |
| Book Value (p.s.) | 44.7 |
| Profit Margin | 14.8 % |
| Operating Margin | 24 % |
| Return on Assets (ttm) | 5.1 % |
| Return on Equity (ttm) | 10.6 % |
| Qtrly Rev. Growth | 0.4 % |
| Gross Profit (p.s.) | 13.21 |
| Sales Per Share | 31.43 |
| EBITDA (p.s.) | 10.65 |
| Qtrly Earnings Growth | 0 % |
| Operating Cash Flow | 409 (M) |
| Levered Free Cash Flow | -165 (M) |
| PE Ratio | 19.36 |
| PEG Ratio | 2 |
| Price to Book value | 1.98 |
| Price to Sales | 2.82 |
| Price to Cash Flow | 9.11 |
| Dividend | 0.57 |
| Forward Dividend | 0 |
| Dividend Yield | 0.6% |
| Dividend Pay Date | Invalid DateTime. |
| Ex-Dividend Date | Invalid DateTime. |

|

|

|

|
|
|
|
|
|