
| 2.8 -1.18 (-29.65%) | 10-22 16:00 | |||||||||||||
|
|
| Short term |  |
|||
| Mid term | |
|||
| Targets | 6-month : | 5.5  |
1-year : | 6.93 |
| Resists | First : | 4.71 |
Second : | 5.93 |
| Pivot price | 4.85 |
|||
| Supports | First : | 2.74 |
Second : | 2.28 |
| MAs | MA(5) : | 3.98 |
MA(20) : | 5.01 |
| MA(100) : | 5.43 |
MA(250) : | 6.14 |
|
| MACD | MACD : | -0.5 |
Signal : | -0.3 |
| %K %D | K(14,3) : | 4.8 |
D(3) : | 10 |
| RSI | RSI(14): 9.3 |
|||
| 52-week | High : | 13.89 | Low : | 2.74 |
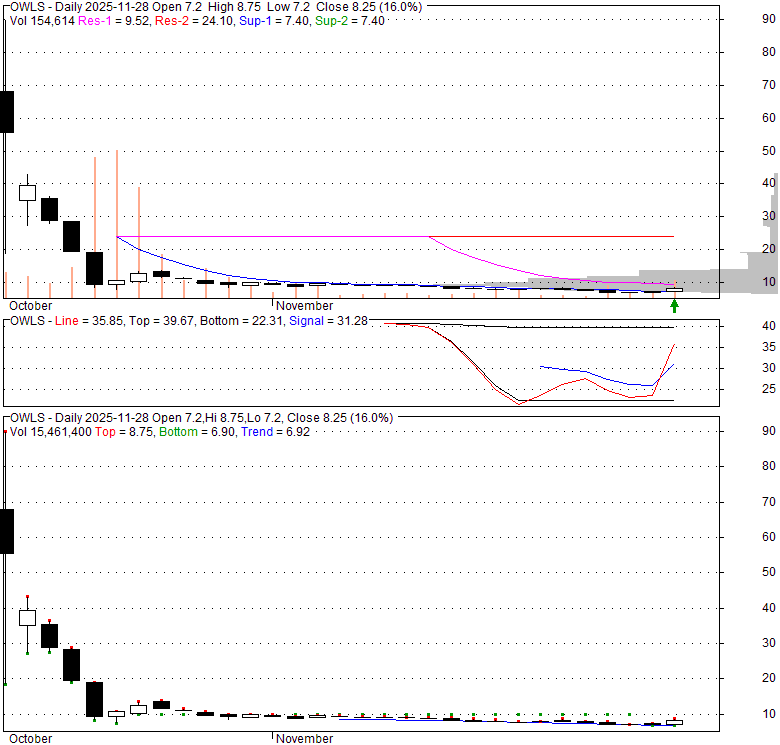
Price has closed below its short-term moving average. Short-term moving average is currently below mid-term; and below long-term moving average. From the relationship between price and moving averages: This stock is BEARISH in short-term; and BEARISH in mid-long term.[ OWLS ] has closed below the lower bollinger band by 20.0%. If price is in a downtrend band; this downward trend might continue. However a short term pullback inside the band is likely. Bollinger Bands are 474.7% wider than normal. The large width of the bands suggest high volatility as compared to its normal range. The bands have been in this wide range for 5 days. This is a sign that the current trend might continue.
| If tomorrow: | Open lower | Open higher |
| High: | 3.98 - 4.02 | 4.02 - 4.04 |
| Low: | 2.7 - 2.72 | 2.72 - 2.74 |
| Close: | 2.77 - 2.81 | 2.81 - 2.83 |
OBOOK Holdings Inc. (OWLS) operates as a blockchain technology firm with a global footprint, including operations across the United States, Japan, Singapore, Hong Kong, Malaysia, and Thailand, as well as various regions in South America and the European Union. The company delivers a suite of e-commerce, hospitality, and payment solutions tailored for businesses and individuals engaged in international transactions. Its diverse product portfolio includes: OwlTing Market, an online marketplace designed to connect local Taiwanese producers and merchants directly with their clientele. OwlTing Blockchain Services, a traceability system leveraging blockchain to provide organic farmers with enhanced transparency regarding their operations and supply chains. OwlNest, a hotel property management system (PMS) that employs blockchain to effectively prevent instances of double bookings. OwlJourney, an online travel agency (OTA) platform that benefits from precise, real-time inventory updates. OwlPay, an API-driven payment suite offering secure, instantaneous, and cost-efficient end-to-end payment solutions, encompassing everything from payment gateways to business disbursements. OwlPay Wallet Pro, a versatile platform delivering hosted digital wallets for corporate clients and unhosted wallet options for individual users. OBOOK Holdings Inc. primarily focuses on e-commerce and blockchain applications, serving sectors such as international travel, food supply chain security, social media platforms, global hotel bookings, and broader blockchain integration services. The company was established in 2010 and is headquartered in Taipei, Taiwan.
Mon, 19 Oct 2026
Enterprise clients top 100 at OBOOK (OWLS) as OwlPay Harbor payment volume multiplies - Stock Titan
Mon, 19 Oct 2026
Owlting Group (NASDAQ: OWLS) Issues CEO Letter to Shareholders Marking One Year on Nasdaq - GlobeNewswire
Wed, 14 Oct 2026
Running on OBOOK (OWLS) since August, Decaf opens dollar accounts for eligible businesses. - Stock Titan
Mon, 21 Sep 2026
OWLS - OBOOK Holdings Inc. | News - OTC Markets
Fri, 28 Aug 2026
News by ACCESS Newswire on TradingView, 2026-08-28 - TradingView
| Price to Book Value: P/BV, a ratio used to compare book value to its current market price, to gauge whether a stock is valued properly. |
Underperform |
| Price to Earnings: PE, the ratio for valuing a company that measures its current share price relative to its earnings per share (EPS). |
Underperform |
| Discounted cash flow: DCF, a valuation method used to estimate the value of an investment based on its expected future cash flows. |
Underperform |
| Return on Assets: ROA, indicates how profitable a company is in relation to its total assets, how efficiently uses assets to generate a profit. |
Underperform |
| Return on Equity: ROE, a measure of financial performance calculated by dividing net income by equity. a gauge of profitability and efficiency. |
Outperform |
| Debt to Equity: evaluate financial leverage, reflects the ability of equity to cover outstanding debts in the event of a business downturn. |
Underperform |
|
Exchange:
NASDAQ
|
|
|
Sector:
Technology
|
|
|
Industry:
Software - Infrastructure
|
|
| Shares Out | 38 (M) |
| Shares Float | 14 (M) |
| Held by Insiders | 54.9 (%) |
| Held by Institutions | 0.7 (%) |
| Shares Short | 61 (K) |
| Shares Short P.Month | 58 (K) |
| EPS | -0.58 |
| EPS Est Next Qtrly | 0 |
| EPS Est This Year | 0 |
| EPS Est Next Year | 0 |
| Book Value (p.s.) | -0.16 |
| Profit Margin | 0 % |
| Operating Margin | -441.6 % |
| Return on Assets (ttm) | -116 % |
| Return on Equity (ttm) | 0 % |
| Qtrly Rev. Growth | 0.8 % |
| Gross Profit (p.s.) | -0.01 |
| Sales Per Share | 0.2 |
| EBITDA (p.s.) | -1.13 |
| Qtrly Earnings Growth | 0 % |
| Operating Cash Flow | -16 (M) |
| Levered Free Cash Flow | 10 (M) |
| PE Ratio | -4.83 |
| PEG Ratio | 0 |
| Price to Book value | -18.67 |
| Price to Sales | 13.42 |
| Price to Cash Flow | -6.5 |
| Dividend | 0 |
| Forward Dividend | 0 |
| Dividend Yield | 0% |
| Dividend Pay Date | Invalid DateTime. |
| Ex-Dividend Date | Invalid DateTime. |

|

|

|

|
|
|
|
|
|