
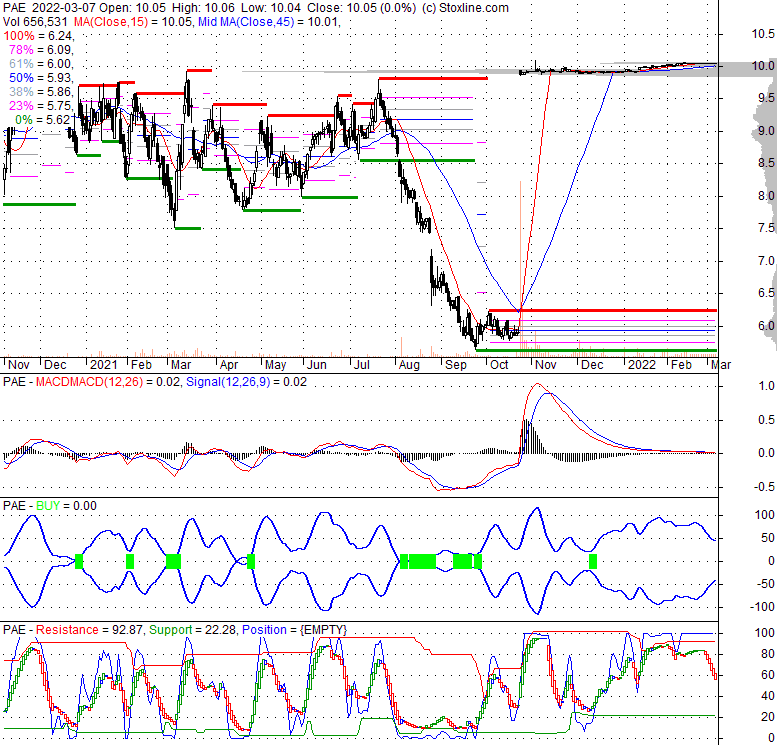
| 10.05 0 (0%) | 04-24 15:47 | |||||||||||||
|
|
| Short term |  |
|||
| Mid term | |
|||
| Targets | 6-month : | 1-year : | ||
| Resists | First : | Second : | ||
| Pivot price | ||||
| Supports | First : | Second : | ||
| MAs | MA(5) : | MA(20) : | ||
| MA(100) : | MA(250) : | |||
| MACD | MACD : | Signal : | ||
| %K %D | K(14,3) : | D(3) : | ||
| RSI | RSI(14): | |||
| 52-week | High : | Low : | ||
| If tomorrow: | Open lower | Open higher |
| High: | - | - |
| Low: | - | - |
| Close: | - | - |
PAE Incorporated specializes in delivering operational support and outsourced services to a diverse clientele, including the U.S. government, allied nations, international organizations, and private companies. The company's operations are structured into two primary segments: Global Mission Services and National Security Solutions. The Global Mission Services division focuses on critical areas such as logistics and stability operations, which cover comprehensive lifecycle management, humanitarian efforts, and broader stabilization initiatives. It also oversees infrastructure management, offering support for mission operations, developing and managing space-related activities, and maintaining test and training ranges. Additionally, this segment ensures force readiness through the upkeep and repair of both military and civilian vehicle and aircraft fleets. Meanwhile, the National Security Solutions segment is dedicated to providing vital counter-threat solutions, including specialized training and anti-terrorism strategies. It also specializes in information optimization, delivering business process outsourcing to government entities for tasks like citizenship processing and litigation support, alongside comprehensive systems maintenance. Furthermore, this segment offers a spectrum of intelligence solutions, encompassing analysis, mission assistance, program oversight, engineering expertise, and various training programs. Founded in 1955, PAE Incorporated maintains its headquarters in Falls Church, Virginia. As of February 15, 2022, the company functions as a subsidiary of Amentum Government Services Holdings LLC.
Tue, 02 Sep 2025
How PAE Engineers is incorporating microgrids into sustainable building designs - Energy-Storage.News
Sat, 19 Feb 2022
PAE Announces Completion of Acquisition by Amentum - Homeland Security Today
Tue, 15 Feb 2022
Amentum Completes Acquisition of PAE - Business Wire
Tue, 15 Feb 2022
PAE Announces Closing of Merger With an Affiliate of Amentum Government Services Holdings LLC - Yahoo Finance
Mon, 25 Oct 2021
Amentum to Acquire PAE Incorporated - Business Wire
Thu, 06 May 2021
PAE prepares for hit from Afghanistan wind-down, looks to projected civilian spending ramp-up - The Business Journals
| Price to Book Value: P/BV, a ratio used to compare book value to its current market price, to gauge whether a stock is valued properly. |
Outperform |
| Price to Earnings: PE, the ratio for valuing a company that measures its current share price relative to its earnings per share (EPS). |
Outperform |
| Discounted cash flow: DCF, a valuation method used to estimate the value of an investment based on its expected future cash flows. |
Outperform |
| Return on Assets: ROA, indicates how profitable a company is in relation to its total assets, how efficiently uses assets to generate a profit. |
Neutral |
| Return on Equity: ROE, a measure of financial performance calculated by dividing net income by equity. a gauge of profitability and efficiency. |
Outperform |
| Debt to Equity: evaluate financial leverage, reflects the ability of equity to cover outstanding debts in the event of a business downturn. |
Outperform |
|
Exchange:
NASDAQ
|
|
|
Sector:
Industrials
|
|
|
Industry:
Specialty Business Services
|
|
| Shares Out | 0 (M) |
| Shares Float | 0 (M) |
| Held by Insiders | (%) |
| Held by Institutions | (%) |
| Shares Short | 0 (K) |
| Shares Short P.Month | 0 (K) |
| EPS | |
| EPS Est Next Qtrly | |
| EPS Est This Year | |
| EPS Est Next Year | |
| Book Value (p.s.) | |
| Profit Margin | % |
| Operating Margin | % |
| Return on Assets (ttm) | % |
| Return on Equity (ttm) | % |
| Qtrly Rev. Growth | % |
| Gross Profit (p.s.) | |
| Sales Per Share | |
| EBITDA (p.s.) | |
| Qtrly Earnings Growth | % |
| Operating Cash Flow | 0 (M) |
| Levered Free Cash Flow | 0 (M) |
| PE Ratio | |
| PEG Ratio | |
| Price to Book value | |
| Price to Sales | |
| Price to Cash Flow |
| Dividend | |
| Forward Dividend | |
| Dividend Yield | 0% |
| Dividend Pay Date | |
| Ex-Dividend Date |

|

|

|

|
|
|
|
|
|