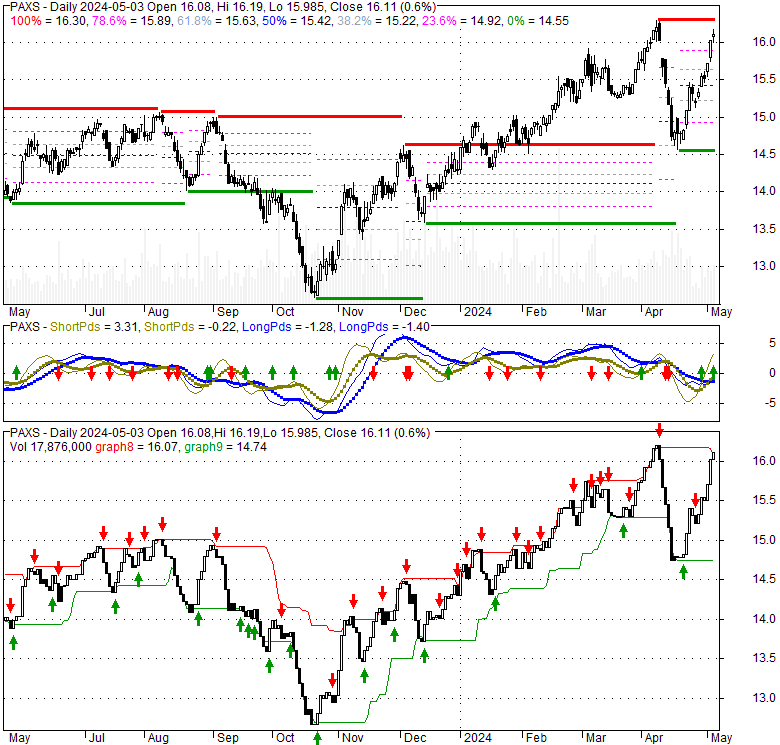
| 15.4 0.31 (2.05%) | 04-23 16:00 | |||||||||||||
|
|
| Short term | |
|||
| Mid term | ||||
| Targets | 6-month : | 18.25 | 1-year : | 19.03 |
| Resists | First : | 15.63 | Second : | 16.29 |
| Pivot price | 15.39 |
|||
| Supports | First : | 14.55 | Second : | 12.1 |
| MAs | MA(5) : | 14.97 |
MA(20) : | 15.47 |
| MA(100) : | 14.93 |
MA(250) : | 14.48 |
|
| MACD | MACD : | -0.2 |
Signal : | -0.1 |
| %K %D | K(14,3) : | 31.6 |
D(3) : | 21.7 |
| RSI | RSI(14): 51.8 |
|||
| 52-week | High : | 16.29 | Low : | 12.56 |
Price has closed above its short-term moving average. Short-term moving average is currently below mid-term; and above long-term moving average. From the relationship between price and moving averages: This stock is NEUTRAL in short-term; and NEUTRAL in mid-long term.[ PAXS ] has closed below upper band by 50.0%. Bollinger Bands are 142.9% wider than normal. The large width of the bands suggest high volatility as compared to its normal range. The bands have been in this wide range for 7 days. This is a sign that the current trend might continue.
| If tomorrow: | Open lower | Open higher |
| High: | 15.47 - 15.53 | 15.53 - 15.58 |
| Low: | 14.93 - 15 | 15 - 15.07 |
| Close: | 15.29 - 15.39 | 15.39 - 15.48 |
PIMCO Access Income Fund is close-ended fixed income mutual fund launched and managed by Pacific Investment Management Company LLC. It invests in fixed income markets of global region. The fund primarily invests in corporate debt, mortgage-related and other asset-backed instruments, government and sovereign debt, taxable municipal bonds, floating-rate income-producing securities with varying maturities. It employs fundamental analysis bottom-up and top-down securities picking approach to create its portfolio. PIMCO Access Income Fund is domiciled in the United States.
Mon, 01 Apr 2024
Want $12500 In Passive Income, Invest $20000 In These 5 Dividend Stocks - 24/7 Wall St.
Sat, 30 Mar 2024
PAXS CEF: PIMCO's Newest Closed End Fund Continues To Deliver (NYSE:PAXS) - Seeking Alpha
Thu, 21 Mar 2024
PIMCO Update Feb 2024 | PDX Makes The Move, Valuations Remain Rich - Seeking Alpha
Fri, 01 Mar 2024
PDI: Can PIMCO's Highest Yielding Closed-End Fund Sustain The Rally? - Seeking Alpha
Thu, 25 Jan 2024
PIMCO CEF Update: PIMCO Struggled To Outperform Last Year - Seeking Alpha
Wed, 22 Nov 2023
PIMCO CEF Update: Getting Ready For PDX - Seeking Alpha
| Price to Book Value: P/BV, a ratio used to compare book value to its current market price, to gauge whether a stock is valued properly. |
Underperform |
| Price to Earnings: PE, the ratio for valuing a company that measures its current share price relative to its earnings per share (EPS). |
Underperform |
| Discounted cash flow: DCF, a valuation method used to estimate the value of an investment based on its expected future cash flows. |
Underperform |
| Return on Assets: ROA, indicates how profitable a company is in relation to its total assets, how efficiently uses assets to generate a profit. |
Underperform |
| Return on Equity: ROE, a measure of financial performance calculated by dividing net income by equity. a gauge of profitability and efficiency. |
Underperform |
| Debt to Equity: evaluate financial leverage, reflects the ability of equity to cover outstanding debts in the event of a business downturn. |
Outperform |

|
Exchange:
NYSE
|
|
|
Sector:
Financial Services
|
|
|
Industry:
Asset Management - Income
|
|
| Shares Out | 44 (M) |
| Shares Float | 0 (M) |
| Held by Insiders | 0.7 (%) |
| Held by Institutions | 26.3 (%) |
| Shares Short | 21 (K) |
| Shares Short P.Month | 38 (K) |
| EPS | -0.1 |
| EPS Est Next Qtrly | 0 |
| EPS Est This Year | 0 |
| EPS Est Next Year | 0 |
| Book Value (p.s.) | 0 |
| Profit Margin | 0 % |
| Operating Margin | 0 % |
| Return on Assets (ttm) | 0 % |
| Return on Equity (ttm) | 0 % |
| Qtrly Rev. Growth | 0 % |
| Gross Profit (p.s.) | 0 |
| Sales Per Share | 0 |
| EBITDA (p.s.) | 0 |
| Qtrly Earnings Growth | 0 % |
| Operating Cash Flow | 0 (M) |
| Levered Free Cash Flow | 0 (M) |
| PE Ratio | -171.12 |
| PEG Ratio | 0 |
| Price to Book value | 0 |
| Price to Sales | 0 |
| Price to Cash Flow | 0 |
| Dividend | 0 |
| Forward Dividend | 0 |
| Dividend Yield | 0% |
| Dividend Pay Date | Invalid DateTime. |
| Ex-Dividend Date | Invalid DateTime. |