
| 24.9 -0.101 (-0.4%) | 11-20 14:22 | |||||||||||||
|
|
| Short term |   |
|||
| Mid term |  |
|||
| Targets | 6-month : | 29.13 |
1-year : | 29.21 |
| Resists | First : | 24.94 |
Second : | 25.01 |
| Pivot price | 24.96 |
|||
| Supports | First : | 24.84 |
Second : | 20.67 |
| MAs | MA(5) : | 24.97 |
MA(20) : | 24.95  |
| MA(100) : | 24.74 |
MA(250) : | 24.39 |
|
| MACD | MACD : | 0 |
Signal : | 0 |
| %K %D | K(14,3) : | 59.2 |
D(3) : | 81 |
| RSI | RSI(14): 43.3 |
|||
| 52-week | High : | 25.26 | Low : | 23.83 |
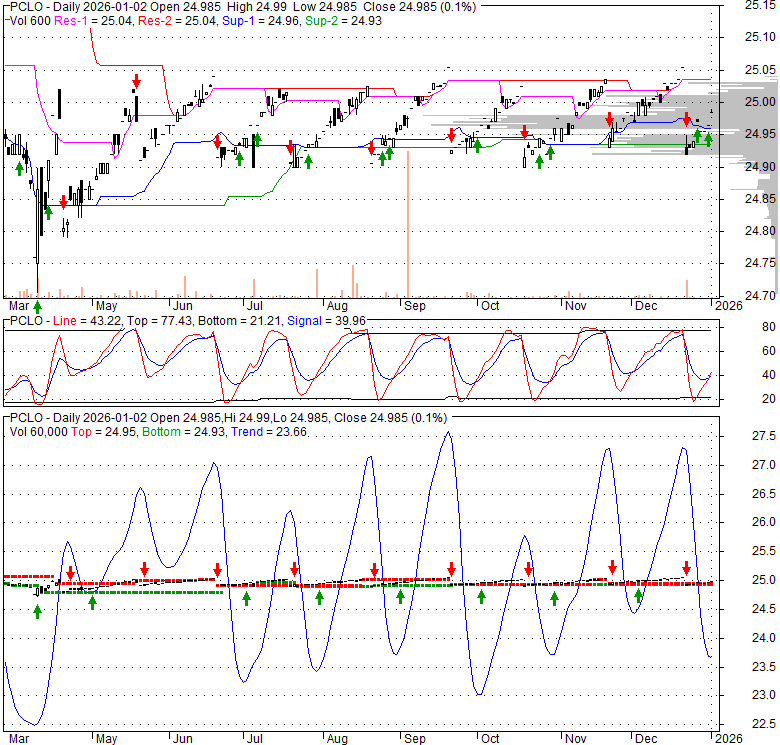
Price has closed below its short-term moving average. Short-term moving average is currently above mid-term; and above long-term moving average. From the relationship between price and moving averages: This stock is NEUTRAL in short-term; and BULLISH in mid-long term.[ PCLO ] has closed above bottom band by 0.3%. Bollinger Bands are 36.7% wider than normal. The current width of the bands does not suggest anything about the future direction or movement of prices.
| If tomorrow: | Open lower | Open higher |
| High: | 24.97 - 25.11 | 25.11 - 25.26 |
| Low: | 24.49 - 24.65 | 24.65 - 24.83 |
| Close: | 24.6 - 24.88 | 24.88 - 25.18 |
PCLO is actively managed, the AAA in the funds name does not indicate the same credit quality as investment grade bonds. All CLOs are below-investment grade corporate loans and derive their credit quality based on their claim to cash flows. AAA CLOs are the highest in the CLO capital structure in case of default. Private credit CLOs tend to offer high income and lower volatility as compared to fixed income investments. PCLO relies on the investment managers expertise in the leveraged loan credit space, combining portfolio construction, disciplined trading strategy and risk management skills, to actively manage the underlying portfolio. The Fund may also invest up to 20% of assets in senior loans, broadly syndicated CLOs, variable-rate debt, ETFs, high yield, and investment-grade bonds. No more than 10% of assets are allocated to a single CLO.
Tue, 23 Sep 2025
Nuveen Securitized Income ETF (NSCI) Stock Price, News, Quote & History - Yahoo! Finance Canada
Thu, 30 Jan 2025
NYSE Active ETF Update | January 30, 2025 - NYSE
Wed, 15 Jan 2025
Active Fixed Income in 2025: Another Golden Year Ahead - ETF Trends
Tue, 03 Dec 2024
PCLO ETF Price and Chart — AMEX:PCLO - TradingView
Wed, 23 Oct 2024
PGIM Short Duration High Yield ETF (PSH) stock price, news, quote and history - Yahoo Finance Singapore
Fri, 12 Apr 2024
PGIM Short Duration High Yield ETF (PSH) Stock Price, News, Quote & History - Yahoo! Finance Canada
| Price to Book Value: P/BV, a ratio used to compare book value to its current market price, to gauge whether a stock is valued properly. |
Neutral |
| Price to Earnings: PE, the ratio for valuing a company that measures its current share price relative to its earnings per share (EPS). |
Neutral |
| Discounted cash flow: DCF, a valuation method used to estimate the value of an investment based on its expected future cash flows. |
Neutral |
| Return on Assets: ROA, indicates how profitable a company is in relation to its total assets, how efficiently uses assets to generate a profit. |
Neutral |
| Return on Equity: ROE, a measure of financial performance calculated by dividing net income by equity. a gauge of profitability and efficiency. |
Neutral |
| Debt to Equity: evaluate financial leverage, reflects the ability of equity to cover outstanding debts in the event of a business downturn. |
Neutral |
|
Exchange:
AMEX
|
|
|
Sector:
Financial Services
|
|
|
Industry:
Asset Management - Bonds
|
|
| Shares Out | 0 (M) |
| Shares Float | 0 (M) |
| Held by Insiders | 0 (%) |
| Held by Institutions | 0 (%) |
| Shares Short | 0 (K) |
| Shares Short P.Month | 0 (K) |
| EPS | 0 |
| EPS Est Next Qtrly | 0 |
| EPS Est This Year | 0 |
| EPS Est Next Year | 0 |
| Book Value (p.s.) | 0 |
| Profit Margin | 0 % |
| Operating Margin | 0 % |
| Return on Assets (ttm) | 0 % |
| Return on Equity (ttm) | 0 % |
| Qtrly Rev. Growth | 0 % |
| Gross Profit (p.s.) | 0 |
| Sales Per Share | 0 |
| EBITDA (p.s.) | 0 |
| Qtrly Earnings Growth | 0 % |
| Operating Cash Flow | 0 (M) |
| Levered Free Cash Flow | 0 (M) |
| PE Ratio | 0 |
| PEG Ratio | 0 |
| Price to Book value | 0 |
| Price to Sales | 0 |
| Price to Cash Flow | 0 |
| Dividend | 0 |
| Forward Dividend | 0 |
| Dividend Yield | 0% |
| Dividend Pay Date | Invalid DateTime. |
| Ex-Dividend Date | Invalid DateTime. |

|

|

|

|
|
|
|
|
|