| 0.0292 0 (0%) | 04-18 16:00 | |||||||||||||
|
|
| Short term | ||||
| Mid term | |
|||
| Targets | 6-month : | 0.21 |
1-year : | 0.33 |
| Resists | First : | 0.18 |
Second : | 0.28 |
| Pivot price | 0.01 |
|||
| Supports | First : | 0 |
Second : | 0 |
| MAs | MA(5) : | 0 |
MA(20) : | 0.03 |
| MA(100) : | 0.77 |
MA(250) : | 1.63 |
|
| MACD | MACD : | -0.1 |
Signal : | -0.2 |
| %K %D | K(14,3) : | 1.5 |
D(3) : | 0.8 |
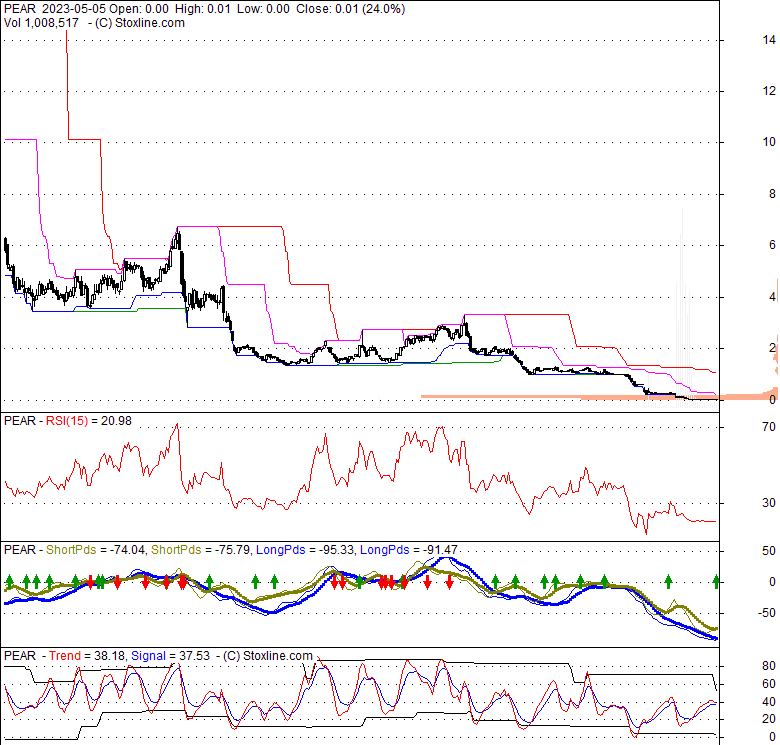
| RSI | RSI(14): 20.5 |
|||
| 52-week | High : | 4.48 | Low : | 0 |
Price has closed below its short-term moving average. Short-term moving average is currently below mid-term; and below long-term moving average. From the relationship between price and moving averages: This stock is BEARISH in short-term; and BEARISH in mid-long term.[ PEAR ] has closed above bottom band by 28.2%. Bollinger Bands are 90.5% narrower than normal. The narrow width of the bands suggests low volatility as compared to its normal range. The bands have been in this narrow range for 6 bars. This is a sign that the market may be about to initiate a new trend.
| If tomorrow: | Open lower | Open higher |
| High: | 0.01 - 0.01 | 0.01 - 0.01 |
| Low: | 0 - 0 | 0 - 0 |
| Close: | 0.01 - 0.01 | 0.01 - 0.01 |
Pear Therapeutics, Inc., a commercial-stage healthcare company, develops and sells software-based medicines. Its commercial products are reSET for the treatment of substance use disorder related to alcohol, cannabis, cocaine, and stimulants; reSET-O for the treatment of opioid use disorder in combination with buprenorphine; and Somryst, a software-based treatment for chronic insomnia. The company is also developing a pipeline of 14 product candidates focusing on psychiatry, neurology, and outside of central nervous system therapeutic areas, such as gastrointestinal, oncology, and cardiovascular. Pear Therapeutics, Inc. was incorporated in 2013 and is based in Boston, Massachusetts.
Fri, 05 Jan 2024
PursueCare Completes Series B Fundraising Round and Acquires Digital Therapeutics Developed by Pear ... - Healthcare IT Today
Wed, 13 Dec 2023
PursueCare Buys Addiction Treatment Apps Made by Failed Pear Therapeutics - Bloomberg
Thu, 26 Oct 2023
Pear Therapeutics Wants More Time To File Ch. 11 Plan - Law360
Thu, 26 Oct 2023
Digital Medicines Sector Draws Lessons From Pear Therapeutics’ Demise - MedCity News
Tue, 24 Oct 2023
Pear Therapeutics: a lesson for future DTx developers - Pharmaceutical Technology
Thu, 27 Jul 2023
Startups Struggle With Insurers Over Digital Treatments - The Wall Street Journal
| Price to Book Value: P/BV, a ratio used to compare book value to its current market price, to gauge whether a stock is valued properly. |
Outperform |
| Price to Earnings: PE, the ratio for valuing a company that measures its current share price relative to its earnings per share (EPS). |
Outperform |
| Discounted cash flow: DCF, a valuation method used to estimate the value of an investment based on its expected future cash flows. |
Neutral |
| Return on Assets: ROA, indicates how profitable a company is in relation to its total assets, how efficiently uses assets to generate a profit. |
Outperform |
| Return on Equity: ROE, a measure of financial performance calculated by dividing net income by equity. a gauge of profitability and efficiency. |
Outperform |
| Debt to Equity: evaluate financial leverage, reflects the ability of equity to cover outstanding debts in the event of a business downturn. |
Outperform |
|
Exchange:
NASDAQ
|
|
|
Sector:
Healthcare
|
|
|
Industry:
Medical - Healthcare Information Services
|
|
| Shares Out | 140 (M) |
| Shares Float | 54 (M) |
| Held by Insiders | 16.5 (%) |
| Held by Institutions | 59.5 (%) |
| Shares Short | 3,430 (K) |
| Shares Short P.Month | 1,700 (K) |
| EPS | -0.37 |
| EPS Est Next Qtrly | 0 |
| EPS Est This Year | 0 |
| EPS Est Next Year | 0 |
| Book Value (p.s.) | 0.21 |
| Profit Margin | 0 % |
| Operating Margin | -938.2 % |
| Return on Assets (ttm) | -51 % |
| Return on Equity (ttm) | -124.8 % |
| Qtrly Rev. Growth | 94.3 % |
| Gross Profit (p.s.) | 0.03 |
| Sales Per Share | 0.09 |
| EBITDA (p.s.) | -0.83 |
| Qtrly Earnings Growth | 0 % |
| Operating Cash Flow | -114 (M) |
| Levered Free Cash Flow | -64 (M) |
| PE Ratio | -0.02 |
| PEG Ratio | 0 |
| Price to Book value | 0.02 |
| Price to Sales | 0.06 |
| Price to Cash Flow | -0.01 |
| Dividend | 0 |
| Forward Dividend | 0 |
| Dividend Yield | 0% |
| Dividend Pay Date | Invalid DateTime. |
| Ex-Dividend Date | Invalid DateTime. |

|

|
|

|
|
|
|
|
|