
| 2.67 0.03 (1.14%) | 05-22 12:38 | |||||||||||||
|
|
| Short term |  |
|||
| Mid term |  |
|||
| Targets | 6-month : | 12.36 | 1-year : | 14.57 |
| Resists | First : | 10.58 | Second : | 12.47 |
| Pivot price | 9.67  |
|||
| Supports | First : | 7.51 | Second : | 6.25 |
| MAs | MA(5) : | 8.64 |
MA(20) : | 9.82 |
| MA(100) : | 10.2 |
MA(250) : | 0 | |
| MACD | MACD : | -0.5 |
Signal : | -0.3 |
| %K %D | K(14,3) : | 19.8  |
D(3) : | 16.4 |
| RSI | RSI(14): 36.6 |
|||
| 52-week | High : | 12.47 | Low : | 7.51 |
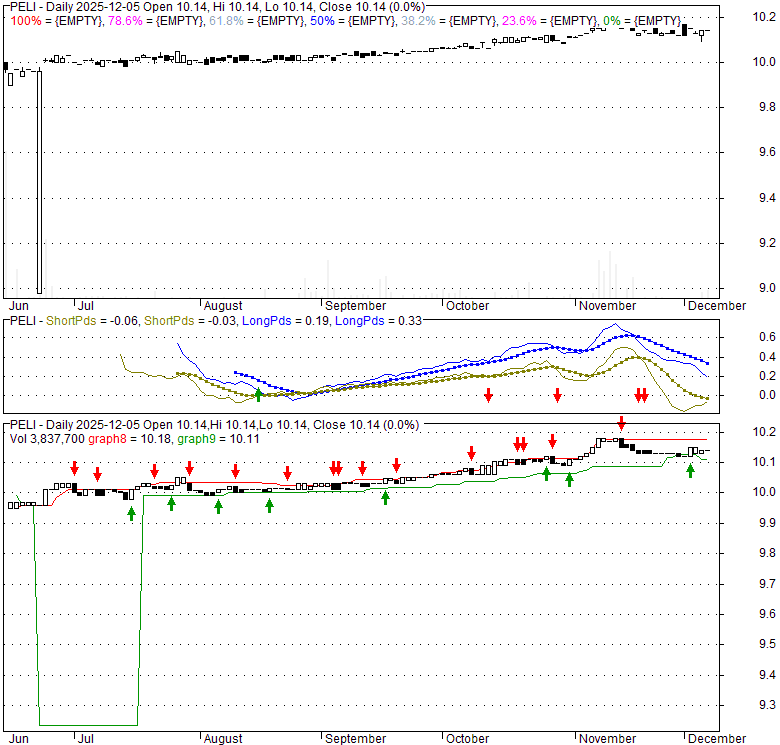
Price has closed below its short-term moving average. Short-term moving average is currently below mid-term; and below long-term moving average. From the relationship between price and moving averages: This stock is BEARISH in short-term; and NEUTRAL in mid-long term.[ PELI ] has closed above bottom band by 11.6%. Bollinger Bands are 627.9% wider than normal. The large width of the bands suggest high volatility as compared to its normal range. The bands have been in this wide range for 8 days. This is a sign that the current trend might continue.
| If tomorrow: | Open lower | Open higher |
| High: | 9.24 - 9.29 | 9.29 - 9.34 |
| Low: | 8 - 8.05 | 8.05 - 8.1 |
| Close: | 8.15 - 8.24 | 8.24 - 8.31 |
Pelican Acquisition Corporation functions as a Cayman Islands-exempted Special Purpose Acquisition Company (SPAC), with the strategic aim of pursuing mergers or acquisitions within the technology industry. Subsequent to its initial public offering, investors gain the flexibility to independently trade the common stock and the accompanying rights, which were initially distributed together as unified units.
Wed, 12 Aug 2026
GLND Stock Price and Chart — NASDAQ:GLND - TradingView
Wed, 25 Mar 2026
Greenland Energy completes SPAC merger, to trade as GLND on Nasdaq - Investing.com
Wed, 25 Mar 2026
Pelican Acquisition Corporation (NASDAQ: PELI) Announces Completion of its Business Combination forming Greenland Energy Company - Yahoo Finance
Fri, 13 Mar 2026
Pelican Acquisition (PELI) Partner Greenland Energy CEO Warns of Structural Oil Supply Risks in Benzinga Interview - NewMediaWire
Wed, 22 Oct 2025
PELI sets GLND merger, first Greenland well targeted next summer - Stock Titan
| Price to Book Value: P/BV, a ratio used to compare book value to its current market price, to gauge whether a stock is valued properly. |
Underperform |
| Price to Earnings: PE, the ratio for valuing a company that measures its current share price relative to its earnings per share (EPS). |
Underperform |
| Discounted cash flow: DCF, a valuation method used to estimate the value of an investment based on its expected future cash flows. |
Underperform |
| Return on Assets: ROA, indicates how profitable a company is in relation to its total assets, how efficiently uses assets to generate a profit. |
Outperform |
| Return on Equity: ROE, a measure of financial performance calculated by dividing net income by equity. a gauge of profitability and efficiency. |
Underperform |
| Debt to Equity: evaluate financial leverage, reflects the ability of equity to cover outstanding debts in the event of a business downturn. |
Outperform |
|
Exchange:
NASDAQ
|
|
|
Sector:
Financial Services
|
|
|
Industry:
Asset Management
|
|
| Shares Out | 12 (M) |
| Shares Float | 8 (M) |
| Held by Insiders | 25.7 (%) |
| Held by Institutions | 69.3 (%) |
| Shares Short | 84 (K) |
| Shares Short P.Month | 46 (K) |
| EPS | 0.14 |
| EPS Est Next Qtrly | 0 |
| EPS Est This Year | 0 |
| EPS Est Next Year | 0 |
| Book Value (p.s.) | -0.03 |
| Profit Margin | 0 % |
| Operating Margin | 0 % |
| Return on Assets (ttm) | -1.6 % |
| Return on Equity (ttm) | 0 % |
| Qtrly Rev. Growth | 0 % |
| Gross Profit (p.s.) | 0 |
| Sales Per Share | 0 |
| EBITDA (p.s.) | 0 |
| Qtrly Earnings Growth | 0 % |
| Operating Cash Flow | -1 (M) |
| Levered Free Cash Flow | 0 (M) |
| PE Ratio | 58.78 |
| PEG Ratio | 0 |
| Price to Book value | -274.34 |
| Price to Sales | 0 |
| Price to Cash Flow | -104.75 |
| Dividend | 0 |
| Forward Dividend | 0 |
| Dividend Yield | 0% |
| Dividend Pay Date | Invalid DateTime. |
| Ex-Dividend Date | Invalid DateTime. |

|

|

|

|
|
|
|
|
|