
| 68.45 0.08 (0.12%) | 09-17 16:00 | |||||||||||||
|
|
| Short term |   |
|||
| Mid term |  |
|||
| Targets | 6-month : | 82.73  |
1-year : | 84.87 |
| Resists | First : | 70.83 |
Second : | 72.66 |
| Pivot price | 69.76 |
|||
| Supports | First : | 67.86 | Second : | 56.45 |
| MAs | MA(5) : | 68.51 |
MA(20) : | 70.33 |
| MA(100) : | 68.7 |
MA(250) : | 70.13 |
|
| MACD | MACD : | -0.8 |
Signal : | -0.5 |
| %K %D | K(14,3) : | 12.8 |
D(3) : | 14.1 |
| RSI | RSI(14): 37.2 |
|||
| 52-week | High : | 74.58 | Low : | 63.42 |
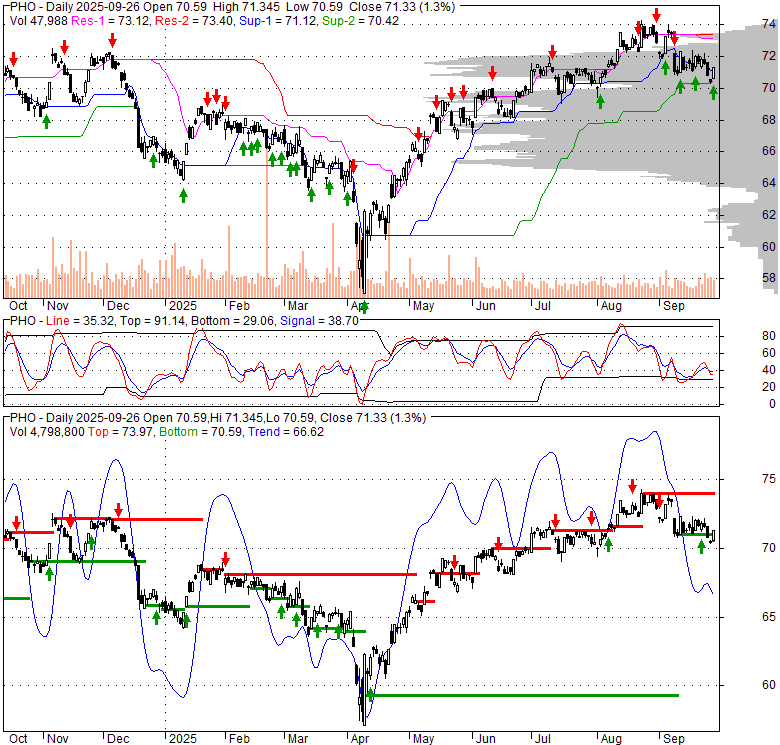
Price has closed below its short-term moving average. Short-term moving average is currently below mid-term; and below long-term moving average. From the relationship between price and moving averages: This stock is BEARISH in short-term; and NEUTRAL in mid-long term.[ PHO ] has closed above bottom band by 25.3%. Bollinger Bands are 35.2% wider than normal. The current width of the bands does not suggest anything about the future direction or movement of prices.
| If tomorrow: | Open lower | Open higher |
| High: | 69.15 - 69.5 | 69.5 - 69.84 |
| Low: | 67.41 - 67.77 | 67.77 - 68.13 |
| Close: | 67.88 - 68.44 | 68.44 - 69.01 |
The Invesco Water Resources ETF (PHO) aims to mirror the performance of the NASDAQ OMX US Water Index. This fund typically allocates at least 90% of its total assets to equity securities, including common stocks, American Depositary Receipts (ADRs), and Global Depositary Receipts (GDRs), issued by US exchange-listed companies. These companies are identified by the index as crucial to the water industry, specializing in products and services for water conservation and purification across residential, commercial, and industrial sectors. Both the fund and its underlying index are rebalanced quarterly and undergo an annual reconstitution each April. As of August 31, 2022, Morningstar awarded the fund an impressive 5-star overall rating among 106 peer funds. Its historical performance ratings included 3 stars for the three-year period (out of 106 funds), and 5 stars for both the five-year (out of 99 funds) and ten-year (out of 87 funds) periods. These Morningstar ratings, sourced from Morningstar Inc., are derived from a risk-adjusted return measure that emphasizes consistent performance and accounts for downside volatility. Funds must possess a minimum three-year history to be rated, and for comparison purposes, open-end mutual funds and exchange-traded funds are considered together. The overall rating represents a weighted average of the 3-, 5-, and 10-year metrics, where applicable, factoring in fees and expenses but excluding sales charges. It is crucial to remember that past performance does not guarantee future returns. Morningstar ratings are subject to monthly changes, and the rating would have been lower if fees had not been waived or expenses reimbursed.
Fri, 11 Sep 2026
Invesco Water Resources ETF (NASDAQ: PHO) Share Price, PHO Stock News, PHO Share Price & Updates - kalkine.com.au
Tue, 01 Sep 2026
Invesco Water Resources ETF (NASDAQ: PHO) Share Price, PHO Stock News, PHO Share Price & Updates - kalkine.ca
Mon, 17 Aug 2026
Invesco Water Resources ETF rated Hold due to l... - pluang.com
Thu, 13 Aug 2026
Is Invesco Water Resources ETF (PHO) a Strong ETF Right Now? - Eastern Progress
Tue, 14 Jul 2026
These 3 Water ETFs Could be Quiet Winners From Infrastructure Spending - MarketBeat
Tue, 02 Jun 2026
Should You Invest in the Invesco Water Resources ETF (PHO)? - Yahoo Finance
| Price to Book Value: P/BV, a ratio used to compare book value to its current market price, to gauge whether a stock is valued properly. |
Neutral |
| Price to Earnings: PE, the ratio for valuing a company that measures its current share price relative to its earnings per share (EPS). |
Neutral |
| Discounted cash flow: DCF, a valuation method used to estimate the value of an investment based on its expected future cash flows. |
Neutral |
| Return on Assets: ROA, indicates how profitable a company is in relation to its total assets, how efficiently uses assets to generate a profit. |
Neutral |
| Return on Equity: ROE, a measure of financial performance calculated by dividing net income by equity. a gauge of profitability and efficiency. |
Neutral |
| Debt to Equity: evaluate financial leverage, reflects the ability of equity to cover outstanding debts in the event of a business downturn. |
Neutral |
|
Exchange:
NASDAQ
|
|
|
Sector:
Financial Services
|
|
|
Industry:
Asset Management
|
|
| Shares Out | 0 (M) |
| Shares Float | 0 (M) |
| Held by Insiders | 0 (%) |
| Held by Institutions | 0 (%) |
| Shares Short | 0 (K) |
| Shares Short P.Month | 0 (K) |
| EPS | 0 |
| EPS Est Next Qtrly | 0 |
| EPS Est This Year | 0 |
| EPS Est Next Year | 0 |
| Book Value (p.s.) | 0 |
| Profit Margin | 0 % |
| Operating Margin | 0 % |
| Return on Assets (ttm) | 0 % |
| Return on Equity (ttm) | 0 % |
| Qtrly Rev. Growth | 0 % |
| Gross Profit (p.s.) | 0 |
| Sales Per Share | 0 |
| EBITDA (p.s.) | 0 |
| Qtrly Earnings Growth | 0 % |
| Operating Cash Flow | 0 (M) |
| Levered Free Cash Flow | 0 (M) |
| PE Ratio | 0 |
| PEG Ratio | 0 |
| Price to Book value | 0 |
| Price to Sales | 0 |
| Price to Cash Flow | 0 |
| Dividend | 0 |
| Forward Dividend | 0 |
| Dividend Yield | 0% |
| Dividend Pay Date | Invalid DateTime. |
| Ex-Dividend Date | Invalid DateTime. |

|

|
|

|
|
|
|
|
|