
| 34.795 0.01 (0.03%) | 08-24 14:14 | |||||||||||||
|
|
| Short term |  |
|||
| Mid term | |
|||
| Targets | 6-month : | 40.76  |
1-year : | 47.61 |
| Resists | First : | 34.9 |
Second : | 40.76 |
| Pivot price | 34.78  |
|||
| Supports | First : | 34.61 |
Second : | 34.43 |
| MAs | MA(5) : | 34.79 |
MA(20) : | 34.75 |
| MA(100) : | 34.73 |
MA(250) : | 34.32 |
|
| MACD | MACD : | 0 |
Signal : | -0.1 |
| %K %D | K(14,3) : | 64.1 |
D(3) : | 72.4 |
| RSI | RSI(14): 50.4 |
|||
| 52-week | High : | 35.02 | Low : | 33.4 |
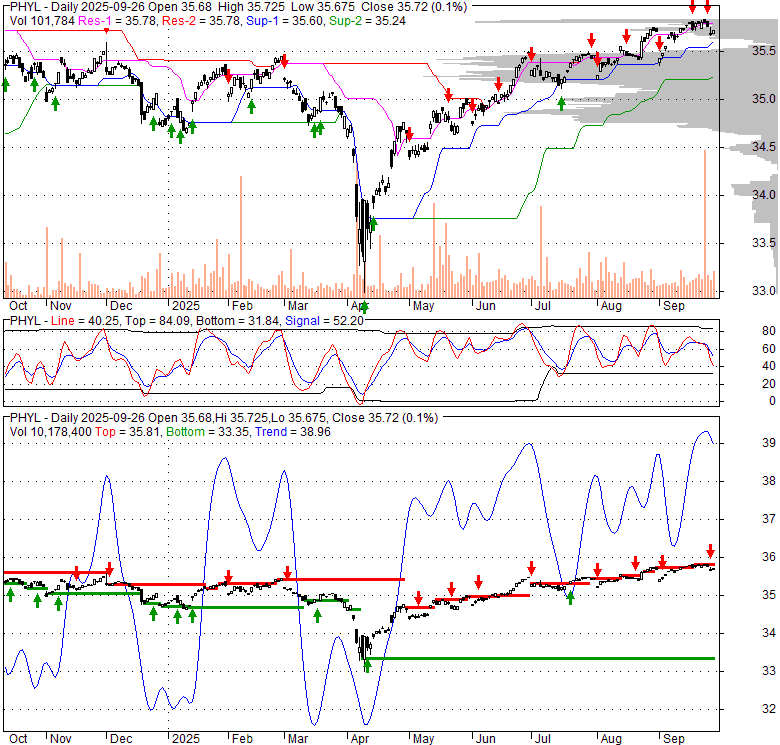
Price has closed below its short-term moving average. Short-term moving average is currently below mid-term; and above long-term moving average. From the relationship between price and moving averages: This stock is BEARISH in short-term; and NEUTRAL in mid-long term.[ PHYL ] has closed below upper band by 46.5%. Bollinger Bands are 61% narrower than normal. The narrow width of the bands suggests low volatility as compared to its normal range. The bands have been in this narrow range for 1 bars. This is a sign that the market may be about to initiate a new trend.
| If tomorrow: | Open lower | Open higher |
| High: | 34.84 - 35.08 | 35.08 - 35.27 |
| Low: | 34.23 - 34.49 | 34.49 - 34.7 |
| Close: | 34.44 - 34.85 | 34.85 - 35.16 |
PGIM ETF Trust - PGIM Active High Yield Bond ETF is an exchange traded fund launched and managed by PGIM Investments LLC. The fund is co-managed by PGIM Fixed Income. It invests in fixed income markets of the United States. The fund invests directly and through derivatives in high yield bonds issued by companies or governments including U.S. government, its agencies and instrumentalities, commercial paper, asset-backed securities, mortgage-backed securities, variable and floating rate instruments, bills, notes and other obligations issued by banks, corporations and other companies (including trust structures), convertible and non-convertible securities (including preferred stocks), loan participations and assignments, obligations issued by non-U.S. banks, companies or non-U.S. governments, and municipal bonds and notes that are rated Ba1 or lower by Moody’s Investors Service, Inc., BB+ or lower by S&P Global Ratings or Fitch, Inc. The fund employs fundamental and quantitative analysis with bottom-up and top-down security picking approach to create its portfolio. It seeks to benchmark the performance of its portfolio against the Bloomberg US High Yield Very Liquid Index. The fund employs proprietary research to create its portfolio. PGIM ETF Trust - PGIM Active High Yield Bond ETF was formed on September 24, 2018 and is domiciled in the United States.
Wed, 12 Aug 2026
PSH: Better Than JNK In Today's Macro (BATS:PSH) - Seeking Alpha
Wed, 12 Aug 2026
How Pgim Active High Yield Bond Etf (PHYL) Affects Rotational Strategy Timing - Stock Traders Daily
Fri, 01 Nov 2024
Financial Calendars - Earnings and Economic Events - GuruFocus
Fri, 19 Apr 2024
ETF Launches - ETF.com
Tue, 31 Mar 2020
FGPR Stock Price and Chart — OTC:FGPR - TradingView
Thu, 27 Sep 2018
PHYL ETF Price and Chart — AMEX:PHYL - TradingView
| Price to Book Value: P/BV, a ratio used to compare book value to its current market price, to gauge whether a stock is valued properly. |
Neutral |
| Price to Earnings: PE, the ratio for valuing a company that measures its current share price relative to its earnings per share (EPS). |
Neutral |
| Discounted cash flow: DCF, a valuation method used to estimate the value of an investment based on its expected future cash flows. |
Neutral |
| Return on Assets: ROA, indicates how profitable a company is in relation to its total assets, how efficiently uses assets to generate a profit. |
Neutral |
| Return on Equity: ROE, a measure of financial performance calculated by dividing net income by equity. a gauge of profitability and efficiency. |
Neutral |
| Debt to Equity: evaluate financial leverage, reflects the ability of equity to cover outstanding debts in the event of a business downturn. |
Neutral |
|
Exchange:
AMEX
|
|
|
Sector:
Financial Services
|
|
|
Industry:
Asset Management
|
|
| Shares Out | 0 (M) |
| Shares Float | 0 (M) |
| Held by Insiders | 0 (%) |
| Held by Institutions | 0 (%) |
| Shares Short | 0 (K) |
| Shares Short P.Month | 0 (K) |
| EPS | 0 |
| EPS Est Next Qtrly | 0 |
| EPS Est This Year | 0 |
| EPS Est Next Year | 0 |
| Book Value (p.s.) | 0 |
| Profit Margin | 0 % |
| Operating Margin | 0 % |
| Return on Assets (ttm) | 0 % |
| Return on Equity (ttm) | 0 % |
| Qtrly Rev. Growth | 0 % |
| Gross Profit (p.s.) | 0 |
| Sales Per Share | 0 |
| EBITDA (p.s.) | 0 |
| Qtrly Earnings Growth | 0 % |
| Operating Cash Flow | 0 (M) |
| Levered Free Cash Flow | 0 (M) |
| PE Ratio | 0 |
| PEG Ratio | 0 |
| Price to Book value | 0 |
| Price to Sales | 0 |
| Price to Cash Flow | 0 |
| Dividend | 0 |
| Forward Dividend | 0 |
| Dividend Yield | 0% |
| Dividend Pay Date | Invalid DateTime. |
| Ex-Dividend Date | Invalid DateTime. |

|

|
|

|
|
|
|
|
|