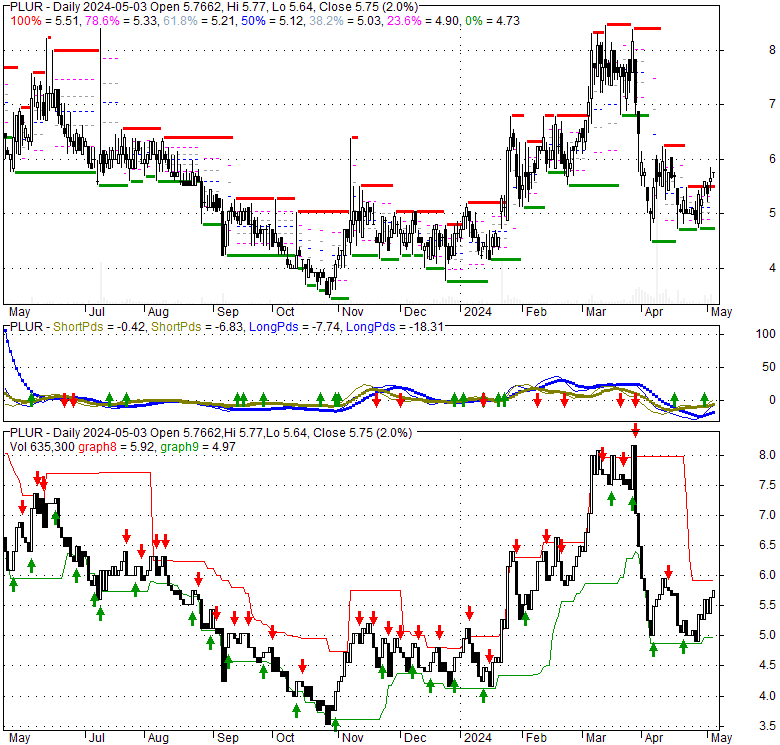
| 5 -0.01 (-0.2%) | 04-23 16:00 | |||||||||||||
|
|
| Short term | |
|||
| Mid term | |
|||
| Targets | 6-month : | 8.07 | 1-year : | 9.81 |
| Resists | First : | 6.91 | Second : | 8.39 |
| Pivot price | 5.42 |
|||
| Supports | First : | 4.5 | Second : | 3.74 |
| MAs | MA(5) : | 5.09 |
MA(20) : | 5.73 |
| MA(100) : | 5.68 |
MA(250) : | 5.67 |
|
| MACD | MACD : | -0.5 |
Signal : | -0.4 |
| %K %D | K(14,3) : | 33.3 |
D(3) : | 31.1 |
| RSI | RSI(14): 35.7 |
|||
| 52-week | High : | 8.56 | Low : | 3.44 |
Price has closed below its short-term moving average. Short-term moving average is currently below mid-term; and below long-term moving average. From the relationship between price and moving averages: This stock is BEARISH in short-term; and NEUTRAL in mid-long term.[ PLUR ] has closed above bottom band by 17.1%. Bollinger Bands are 24.7% narrower than normal. The current width of the bands does not suggest anything about the future direction or movement of prices.
| If tomorrow: | Open lower | Open higher |
| High: | 5.1 - 5.13 | 5.13 - 5.16 |
| Low: | 4.91 - 4.94 | 4.94 - 4.98 |
| Close: | 4.94 - 5 | 5 - 5.06 |
Pluri Inc., a biotechnology company, focuses on the development of placenta-based cell therapy product candidates for the treatment of multiple inflammatory, muscle injuries, and hematologic conditions. The company develops placental expanded (PLX) based cell therapy products, including PLX-PAD that is in Phase III clinical trials for the muscle recovery after surgery for hip fracture; in Phase II clinical trails for the treatment of acute respiratory distress syndrome associated with COVID-19; and in Phase I/II clinical trial for treatment of steroid-refractory graft versus host disease. It also develops PLX-R18 for incomplete hematopoietic recovery following hematopoietic cell transplantation, as well as a solution for the treatment of acute radiation syndrome. The company was formerly known as Pluristem Therapeutics Inc. and changed its name to Pluri Inc. in July 2022. Pluri Inc. was incorporated in 2001 and is based in Haifa, Israel.
Mon, 08 Apr 2024
Pluri Inc. announces breakthrough in immune cell therapy production - Investing.com India
Mon, 08 Apr 2024
Pluri stock jumps 9% on US patent for immune cell production (NASDAQ:PLUR) - Seeking Alpha
Thu, 29 Feb 2024
Pluri Launches Sustainable Cell-Based Coffee As Countermeasure for Global Coffee Crisis - BevNET.com
Wed, 24 Jan 2024
Israeli co Pluri launches cell-based coffee - Globes
Mon, 08 Jan 2024
Pluri Launches Advanced Global Cell Therapy Contract Development and Manufacturing Organization - BioSpace
Thu, 13 Jul 2023
Pluri Announces Appointment of Entrepreneur Lorne Abony to Board of Directors - Yahoo Finance
| Price to Book Value: P/BV, a ratio used to compare book value to its current market price, to gauge whether a stock is valued properly. |
Outperform |
| Price to Earnings: PE, the ratio for valuing a company that measures its current share price relative to its earnings per share (EPS). |
Underperform |
| Discounted cash flow: DCF, a valuation method used to estimate the value of an investment based on its expected future cash flows. |
Underperform |
| Return on Assets: ROA, indicates how profitable a company is in relation to its total assets, how efficiently uses assets to generate a profit. |
Underperform |
| Return on Equity: ROE, a measure of financial performance calculated by dividing net income by equity. a gauge of profitability and efficiency. |
Underperform |
| Debt to Equity: evaluate financial leverage, reflects the ability of equity to cover outstanding debts in the event of a business downturn. |
Outperform |

|
Exchange:
NASDAQ
|
|
|
Sector:
Healthcare
|
|
|
Industry:
Biotechnology
|
|
| Shares Out | -13 (M) |
| Shares Float | 0 (M) |
| Held by Insiders | 5.23e+006 (%) |
| Held by Institutions | 3.16e+006 (%) |
| Shares Short | 0 (K) |
| Shares Short P.Month | 0 (K) |
| EPS | 0 |
| EPS Est Next Qtrly | 0 |
| EPS Est This Year | 0 |
| EPS Est Next Year | 0 |
| Book Value (p.s.) | -4.64 |
| Profit Margin | 0 % |
| Operating Margin | -4 % |
| Return on Assets (ttm) | 964.7 % |
| Return on Equity (ttm) | -29.9 % |
| Qtrly Rev. Growth | 357000 % |
| Gross Profit (p.s.) | -24.78 |
| Sales Per Share | -95.5 |
| EBITDA (p.s.) | 0 |
| Qtrly Earnings Growth | -2.394e+007 % |
| Operating Cash Flow | 0 (M) |
| Levered Free Cash Flow | 0 (M) |
| PE Ratio | 0 |
| PEG Ratio | 0 |
| Price to Book value | -1.08 |
| Price to Sales | -0.06 |
| Price to Cash Flow | 0 |
| Dividend | 12800 |
| Forward Dividend | 24590 |
| Dividend Yield | 256000% |
| Dividend Pay Date | Invalid DateTime. |
| Ex-Dividend Date | Invalid DateTime. |