| 12.5 0.02 (0.16%) | 12-26 16:00 | |||||||||||||
|
|
| Short term | |
|||
| Mid term | |
|||
| Targets | 6-month : | 15.9 | 1-year : | 16.76 |
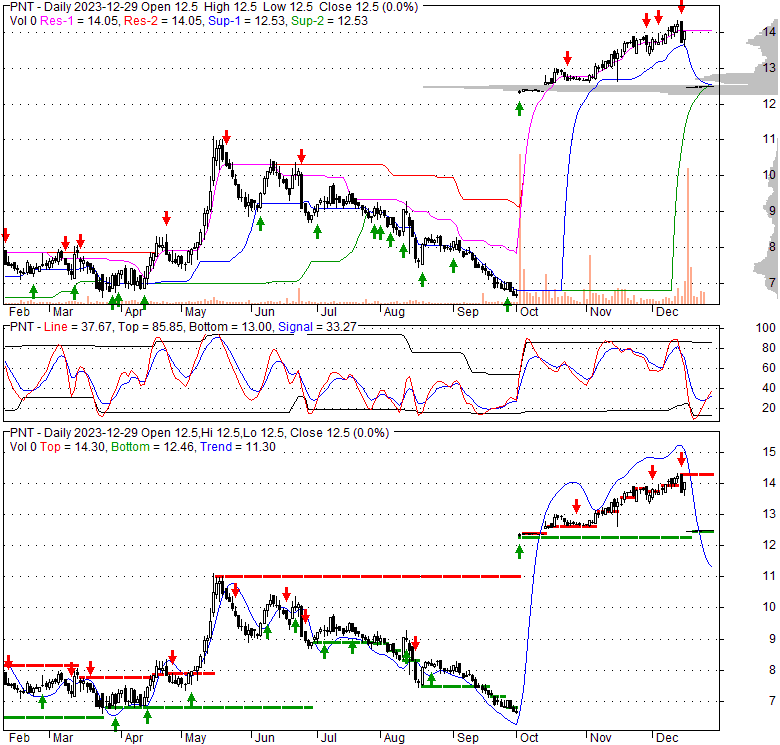
| Resists | First : | 13.61 | Second : | 14.35 |
| Pivot price | 13.1 |
|||
| Supports | First : | 12.43 | Second : | 10.34 |
| MAs | MA(5) : | 12.49 |
MA(20) : | 13.27 |
| MA(100) : | 11.04 |
MA(250) : | 9.38 |
|
| MACD | MACD : | -0.3 |
Signal : | -0.1 |
| %K %D | K(14,3) : | 3.6 | D(3) : | 3.5 |
| RSI | RSI(14): 35.3 | |||
| 52-week | High : | 14.35 | Low : | 6.57 |
Price has closed above its short-term moving average. Short-term moving average is currently below mid-term; and above long-term moving average. From the relationship between price and moving averages: This stock is NEUTRAL in short-term; and NEUTRAL in mid-long term.[ PNT ] has closed above bottom band by 30.4%. Bollinger Bands are 33.4% wider than normal. The current width of the bands does not suggest anything about the future direction or movement of prices.
| If tomorrow: | Open lower | Open higher |
| High: | 12.52 - 12.58 | 12.58 - 12.63 |
| Low: | 12.35 - 12.42 | 12.42 - 12.48 |
| Close: | 12.4 - 12.51 | 12.51 - 12.59 |
POINT Biopharma Global Inc., a radiopharmaceutical company, focuses on the development and commercialization of radioligands that fight cancer. Its lead product candidates include PNT2002, a prostate-specific membrane antigen (PSMA) targeted radioligand that is in Phase III trial for the treatment of metastatic castration-resistant prostate cancer; and PNT2003, a somatostatin-targeted radioligand, which is in Phase III trial for the treatment of neuroendocrine tumors. The company is also developing PNT2001, a next-generation PSMA-targeting product candidate for the treatment of non-metastatic castration sensitive prostate cancer, which is under preclinical studies; and PNT-2004, a fibroblast activation protein-a targeting program being developed for use in multiple tumor types that is under preclinical studies. In addition, it has product candidates being developed on CanSEEK technology sub-licensed from both Bach Biosciences LLC and Avacta Life Sciences Limited. POINT Biopharma Global Inc. was founded in 2019 and is headquartered in Indianapolis, Indiana.
Wed, 27 Dec 2023
Lilly Completes Acquisition of POINT Biopharma | Eli Lilly and Company - Investors | Eli Lilly and Company
Fri, 22 Dec 2023
Lilly Extends Tender Offer to Acquire POINT Biopharma to Dec. 22, 2023 - PR Newswire
Mon, 18 Dec 2023
Lantheus and Point Biopharma shares drop on prostate cancer treatment data - MarketWatch
Wed, 13 Dec 2023
POINT Biopharma Global (PNT) News: Johnson Fistel Investigates Proposed Sale; Is $12.50 a Fair Price? - GlobeNewswire
Fri, 08 Dec 2023
POINT Biopharma Global Inc. (PNT) Upgraded to Buy: Here's What You Should Know - Yahoo Finance
Mon, 06 Nov 2023
Point Biopharma stock quickly gains as big holder comes out against Eli Lilly deal - Seeking Alpha
| Price to Book Value: P/BV, a ratio used to compare book value to its current market price, to gauge whether a stock is valued properly. |
Outperform |
| Price to Earnings: PE, the ratio for valuing a company that measures its current share price relative to its earnings per share (EPS). |
Underperform |
| Discounted cash flow: DCF, a valuation method used to estimate the value of an investment based on its expected future cash flows. |
Outperform |
| Return on Assets: ROA, indicates how profitable a company is in relation to its total assets, how efficiently uses assets to generate a profit. |
Neutral |
| Return on Equity: ROE, a measure of financial performance calculated by dividing net income by equity. a gauge of profitability and efficiency. |
Underperform |
| Debt to Equity: evaluate financial leverage, reflects the ability of equity to cover outstanding debts in the event of a business downturn. |
Neutral |
|
Exchange:
NASDAQ
|
|
|
Sector:
Healthcare
|
|
|
Industry:
Biotechnology
|
|
| Shares Out | 0 (M) |
| Shares Float | 107 (M) |
| Held by Insiders | 8.747e+007 (%) |
| Held by Institutions | 14.9 (%) |
| Shares Short | 3,670 (K) |
| Shares Short P.Month | 0 (K) |
| EPS | 1.1037e+008 |
| EPS Est Next Qtrly | 0 |
| EPS Est This Year | 0 |
| EPS Est Next Year | 0 |
| Book Value (p.s.) | 0 |
| Profit Margin | 39.6 % |
| Operating Margin | -1 % |
| Return on Assets (ttm) | 61.8 % |
| Return on Equity (ttm) | 16.7 % |
| Qtrly Rev. Growth | 2.4369e+008 % |
| Gross Profit (p.s.) | 0 |
| Sales Per Share | 2.27 |
| EBITDA (p.s.) | 1.08 |
| Qtrly Earnings Growth | 1.1 % |
| Operating Cash Flow | 0 (M) |
| Levered Free Cash Flow | 112 (M) |
| PE Ratio | 0 |
| PEG Ratio | 0 |
| Price to Book value | 0 |
| Price to Sales | 5.49 |
| Price to Cash Flow | -0 |
| Dividend | 0 |
| Forward Dividend | 3e+006 |
| Dividend Yield | 0% |
| Dividend Pay Date | Invalid DateTime. |
| Ex-Dividend Date | Invalid DateTime. |

|

|
|

|
|
|
|
|
|