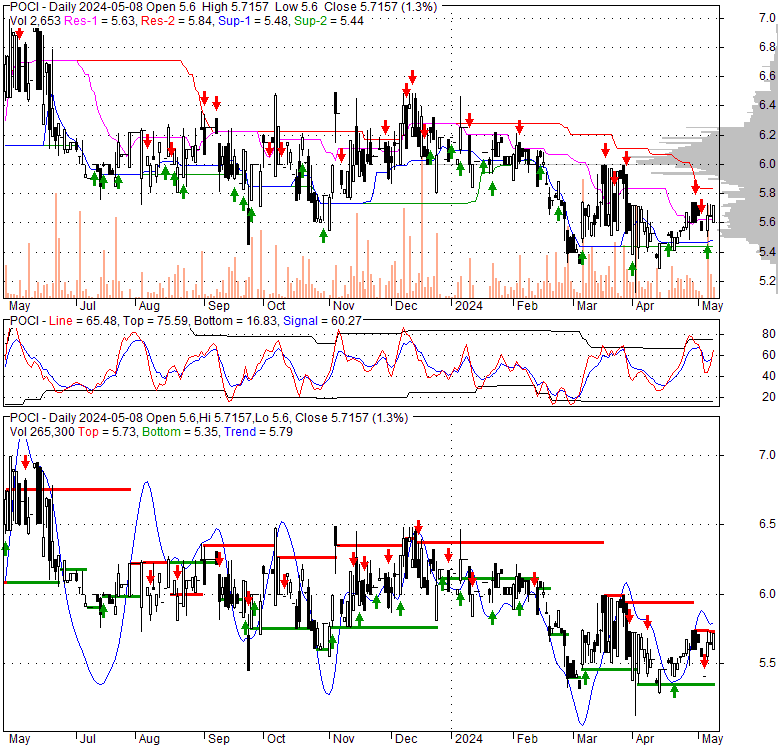
| 5.6 -0.06 (-1.06%) | 04-26 16:00 | |||||||||||||
|
|
| Short term | |
|||
| Mid term | ||||
| Targets | 6-month : | 7 | 1-year : | 8.18 |
| Resists | First : | 6 | Second : | 7 |
| Pivot price | 5.51 | |||
| Supports | First : | 5.45 | Second : | 5.11 |
| MAs | MA(5) : | 5.57 |
MA(20) : | 5.55 |
| MA(100) : | 5.86 |
MA(250) : | 6.01 |
|
| MACD | MACD : | -0.1 |
Signal : | -0.1 |
| %K %D | K(14,3) : | 79.3 |
D(3) : | 71.3 |
| RSI | RSI(14): 50.5 |
|||
| 52-week | High : | 6.98 | Low : | 5.11 |
Price has closed above its short-term moving average. Short-term moving average is currently below mid-term; and below long-term moving average. From the relationship between price and moving averages: This stock is NEUTRAL in short-term; and BEARISH in mid-long term.[ POCI ] has closed below upper band by 19.8%. Bollinger Bands are 42.8% narrower than normal. The narrow width of the bands suggests low volatility as compared to its normal range. The bands have been in this narrow range for 2 bars. This is a sign that the market may be about to initiate a new trend.
| If tomorrow: | Open lower | Open higher |
| High: | 5.65 - 5.68 | 5.68 - 5.7 |
| Low: | 5.41 - 5.44 | 5.44 - 5.47 |
| Close: | 5.55 - 5.6 | 5.6 - 5.64 |
Precision Optics Corporation, Inc. designs, develops, manufactures, and sells specialized optical and illumination systems and related components primarily in the United States and the European Economic Area. It offers medical instrumentation products, including endoscopes and endocouplers, as well as other custom imaging and illumination products, such as Microprecision lenses and micro medical cameras, and 3D endoscopes for use in minimally invasive surgical procedures by hospitals and physicians. The company also provides components and assemblies for industrial and military use. It markets its products to medical device companies. The company was incorporated in 1982 and is based in Gardner, Massachusetts.
Thu, 25 Apr 2024
Precision Optics Announces Receipt of $1.26 Million Follow On Production Order from Large Defense Company - GlobeNewswire
Thu, 25 Apr 2024
Precision Optics lands an additional $1.25M order from U.S. Defense contractor - Investing.com
Tue, 23 Apr 2024
Precision Optics to Present at the Planet MicroCap Showcase: VEGAS 2024 on Wednesday, May 1, 2024 & 1x1 ... - Yahoo Finance UK
Thu, 18 Apr 2024
Precision Optics secures $720k defense order - Investing.com India
Thu, 18 Apr 2024
Precision Optics Announces Receipt of $720,000 Follow-On - GlobeNewswire
Thu, 18 Apr 2024
Precision Optics Announces Receipt of $720000 Follow-On Production Order from Defense/Aerospace Customer for ... - Marketscreener.com
| Price to Book Value: P/BV, a ratio used to compare book value to its current market price, to gauge whether a stock is valued properly. |
Outperform |
| Price to Earnings: PE, the ratio for valuing a company that measures its current share price relative to its earnings per share (EPS). |
Underperform |
| Discounted cash flow: DCF, a valuation method used to estimate the value of an investment based on its expected future cash flows. |
Neutral |
| Return on Assets: ROA, indicates how profitable a company is in relation to its total assets, how efficiently uses assets to generate a profit. |
Underperform |
| Return on Equity: ROE, a measure of financial performance calculated by dividing net income by equity. a gauge of profitability and efficiency. |
Underperform |
| Debt to Equity: evaluate financial leverage, reflects the ability of equity to cover outstanding debts in the event of a business downturn. |
Outperform |

|
Exchange:
NASDAQ
|
|
|
Sector:
Healthcare
|
|
|
Industry:
Medical - Instruments & Supplies
|
|
| Shares Out | 6 (M) |
| Shares Float | 4 (M) |
| Held by Insiders | 25.8 (%) |
| Held by Institutions | 26.6 (%) |
| Shares Short | 8 (K) |
| Shares Short P.Month | 8 (K) |
| EPS | -0.29 |
| EPS Est Next Qtrly | 0 |
| EPS Est This Year | 0 |
| EPS Est Next Year | 0 |
| Book Value (p.s.) | 1.87 |
| Profit Margin | -9 % |
| Operating Margin | -14.7 % |
| Return on Assets (ttm) | -7.9 % |
| Return on Equity (ttm) | -16.3 % |
| Qtrly Rev. Growth | -18.2 % |
| Gross Profit (p.s.) | 0 |
| Sales Per Share | 3.16 |
| EBITDA (p.s.) | -0.34 |
| Qtrly Earnings Growth | 0 % |
| Operating Cash Flow | -2 (M) |
| Levered Free Cash Flow | -1 (M) |
| PE Ratio | -19.32 |
| PEG Ratio | 0 |
| Price to Book value | 2.99 |
| Price to Sales | 1.76 |
| Price to Cash Flow | -21.38 |
| Dividend | 0 |
| Forward Dividend | 0 |
| Dividend Yield | 0% |
| Dividend Pay Date | Invalid DateTime. |
| Ex-Dividend Date | Invalid DateTime. |