
| 93.3895 -1.981 (-2.08%) | 08-25 13:11 | |||||||||||||
|
|
| Short term |  |
|||
| Mid term |  |
|||
| Targets | 6-month : | 115.8 | 1-year : | 135.26 |
| Resists | First : | 99.15 | Second : | 115.8 |
| Pivot price | 96.45 |
|||
| Supports | First : | 90.72 | Second : | 85.51 |
| MAs | MA(5) : | 95.38 |
MA(20) : | 95.1  |
| MA(100) : | 91.87 |
MA(250) : | 88.12 |
|
| MACD | MACD : | 1.1 |
Signal : | 1.5 |
| %K %D | K(14,3) : | 46 |
D(3) : | 61.6 |
| RSI | RSI(14): 46.3 |
|||
| 52-week | High : | 109.48 | Low : | 74.91 |
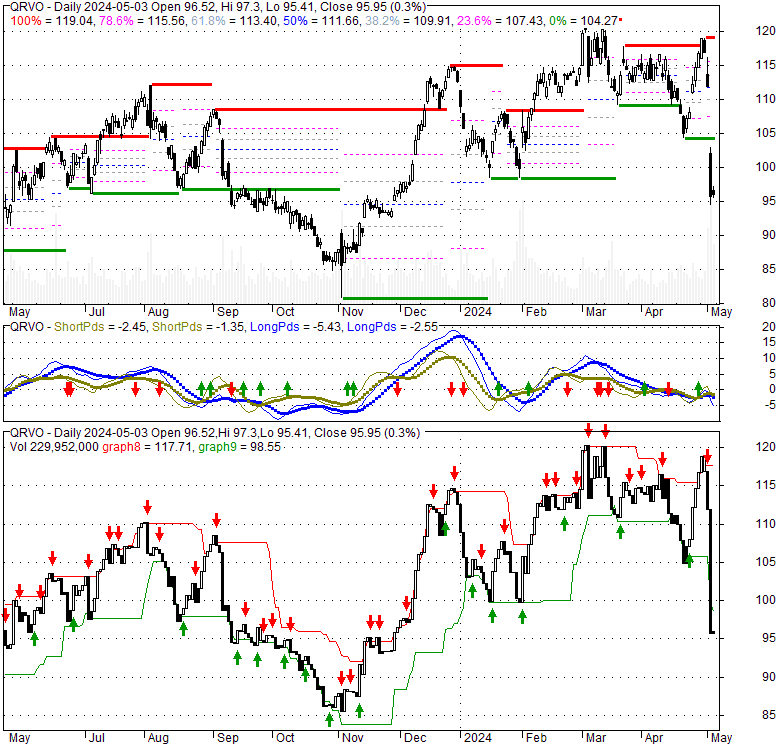
Price has closed below its short-term moving average. Short-term moving average is currently above mid-term; and above long-term moving average. From the relationship between price and moving averages: This stock is NEUTRAL in short-term; and NEUTRAL in mid-long term.[ QRVO ] has closed below the lower bollinger band by 8.2%. Bollinger Bands are 53.9% narrower than normal. The narrow width of the bands suggests low volatility as compared to its normal range. The bands have been in this narrow range for 1 bars. This is a sign that the market may be about to initiate a new trend.
| If tomorrow: | Open lower | Open higher |
| High: | 95.77 - 96.55 | 96.55 - 97.07 |
| Low: | 92.28 - 93.15 | 93.15 - 93.73 |
| Close: | 94.23 - 95.58 | 95.58 - 96.49 |
Qorvo, Inc. is a global technology company focused on developing and bringing to market a diverse range of products and innovations for the wireless, wired, and power sectors. Its operations are organized into two primary divisions: Mobile Products, and Infrastructure and Defense Products. Within its Mobile Products segment, Qorvo supplies critical components for a wide array of consumer electronics, including smartphones, wearables, laptops, and tablets. These offerings encompass radio frequency (RF) power management integrated circuits (PMICs), ultra-wideband (UWB) system-on-a-chip (SoC) and system-in-package (SiP) solutions, MEMS sensors, antenna tuners and antennaplexers, along with various discrete components like multiplexers, duplexers, filters, and switches. The Infrastructure and Defense Products segment addresses a broad spectrum of industries: For cellular base stations, Qorvo provides components such as switch-low noise amplifier (LNA) modules, variable gain amplifiers (VGAs), integrated power amplifier (PA) Doherty modules, discrete LNAs, and high-power GaN amplifiers. It also manufactures Silicon Carbide (SiC) products, including Schottky diodes and transistors, vital for applications in the automotive, industrial, IT infrastructure, and renewable energy sectors. The company delivers smart home solutions through SoC hardware, firmware, and application software. Power management offerings include programmable PMICs and power application controllers. For defense and aerospace clients, particularly defense primes, Qorvo supplies RF products and specialized compound semiconductor foundry services. In automotive connectivity, it offers RF and UWB SoC solutions. Lastly, Wi-Fi products feature PAs, switches, LNAs, bulk acoustic wave (BAW) filters, and integrated front-end modules (FEMs). Qorvo distributes its products through a dual approach: direct sales to original equipment manufacturers (OEMs) and original design manufacturers (ODMs), and indirectly via a network of sales representatives and authorized distributors. Established in 1957, the company maintains its headquarters in Greensboro, North Carolina.
Tue, 25 Aug 2026
Qorvo (NASDAQ:QRVO) Stock Price Down 3.5% - Here's What Happened - MarketBeat
Tue, 25 Aug 2026
Paradigm Capital Management Inc. NY Makes New $2.41 Million Investment in Qorvo, Inc. $QRVO - MarketBeat
Tue, 25 Aug 2026
Callan Family Office LLC Takes $1.03 Million Position in Qorvo, Inc. $QRVO - MarketBeat
Mon, 24 Aug 2026
Athos Capital Ltd Takes Position in Qorvo, Inc. $QRVO - MarketBeat
Sun, 23 Aug 2026
Qorvo (QRVO) Upgraded to Buy: Here's What You Should Know - Eastern Progress
Tue, 18 Aug 2026
Qorvo Inc (QRVO) SVP & CFO Grant Brown Sells 5,179 Shares - GuruFocus
| Price to Book Value: P/BV, a ratio used to compare book value to its current market price, to gauge whether a stock is valued properly. |
Neutral |
| Price to Earnings: PE, the ratio for valuing a company that measures its current share price relative to its earnings per share (EPS). |
Underperform |
| Discounted cash flow: DCF, a valuation method used to estimate the value of an investment based on its expected future cash flows. |
Outperform |
| Return on Assets: ROA, indicates how profitable a company is in relation to its total assets, how efficiently uses assets to generate a profit. |
Outperform |
| Return on Equity: ROE, a measure of financial performance calculated by dividing net income by equity. a gauge of profitability and efficiency. |
Outperform |
| Debt to Equity: evaluate financial leverage, reflects the ability of equity to cover outstanding debts in the event of a business downturn. |
Underperform |
|
Exchange:
NASDAQ
|
|
|
Sector:
Technology
|
|
|
Industry:
Semiconductors
|
|
| Shares Out | 88 (M) |
| Shares Float | 82 (M) |
| Held by Insiders | 0.5 (%) |
| Held by Institutions | 99.8 (%) |
| Shares Short | 6,560 (K) |
| Shares Short P.Month | 6,770 (K) |
| EPS | 4.3 |
| EPS Est Next Qtrly | 0 |
| EPS Est This Year | 0 |
| EPS Est Next Year | 0 |
| Book Value (p.s.) | 39.36 |
| Profit Margin | 10.9 % |
| Operating Margin | 15.7 % |
| Return on Assets (ttm) | 6.7 % |
| Return on Equity (ttm) | 11.5 % |
| Qtrly Rev. Growth | -4.2 % |
| Gross Profit (p.s.) | 20.06 |
| Sales Per Share | 41.26 |
| EBITDA (p.s.) | 10.03 |
| Qtrly Earnings Growth | 255.6 % |
| Operating Cash Flow | 765 (M) |
| Levered Free Cash Flow | 476 (M) |
| PE Ratio | 21.54 |
| PEG Ratio | 0.8 |
| Price to Book value | 2.35 |
| Price to Sales | 2.25 |
| Price to Cash Flow | 10.7 |
| Dividend | 0 |
| Forward Dividend | 0 |
| Dividend Yield | 0% |
| Dividend Pay Date | Invalid DateTime. |
| Ex-Dividend Date | Invalid DateTime. |

|

|
|

|
|
|
|
|
|