| 0 (0%) | 06-28 18:07 | |||||||||||||
|
|
| Short term | |
|||
| Mid term | ||||
| Targets | 6-month : | 134.42 |
1-year : | 141.02 |
| Resists | First : | 115.09 |
Second : | 120.73 |
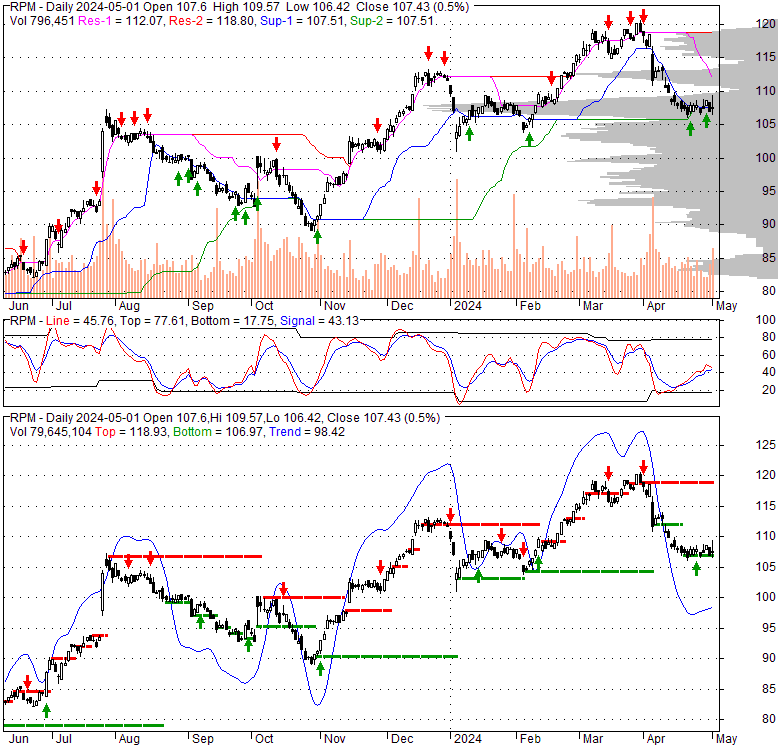
| Pivot price | 111.39 |
|||
| Supports | First : | 105.94 |
Second : | 88.15 |
| MAs | MA(5) : | 107.51 |
MA(20) : | 113.21 |
| MA(100) : | 110.53 |
MA(250) : | 99.57 |
|
| MACD | MACD : | -2.3 |
Signal : | -1.4 |
| %K %D | K(14,3) : | 4.3 |
D(3) : | 4.3 |
| RSI | RSI(14): 29.1 |
|||
| 52-week | High : | 120.73 | Low : | 78.51 |
Price has closed below its short-term moving average. Short-term moving average is currently below mid-term; and below long-term moving average. From the relationship between price and moving averages: This stock is BEARISH in short-term; and NEUTRAL in mid-long term.[ RPM ] has closed above bottom band by 18.8%. Bollinger Bands are 79.5% wider than normal. The large width of the bands suggest high volatility as compared to its normal range. The bands have been in this wide range for 7 days. This is a sign that the current trend might continue.
| If tomorrow: | Open lower | Open higher |
| High: | 108.35 - 108.95 | 108.95 - 109.43 |
| Low: | 104.08 - 104.94 | 104.94 - 105.63 |
| Close: | 105.31 - 106.58 | 106.58 - 107.61 |
Wed, 17 Apr 2024
Options Traders Expect Huge Moves in Rice Midstream (RMP) Stock - Yahoo Canada Shine On
Sun, 10 Feb 2019
EQT, Rice Energy $8.2 Billion Merger Creates Northeast Gas Giant - Hart Energy
Sun, 10 Feb 2019
Rice Energy Makes Dry Gas Run With $2.7 Billion Deal - Hart Energy
Mon, 30 Jul 2018
EQT Corp Midstream Spin-Off To Be Completed In Q4 - Forbes
Fri, 11 May 2018
Implied Volatility Surging for Rice Midstream (RMP) Stock Options - Yahoo News
Wed, 21 Feb 2018
EQT Steps Into New Era, As Separation of Midstream, Upstream Businesses Begins - Natural Gas Intelligence
| Price to Book Value: P/BV, a ratio used to compare book value to its current market price, to gauge whether a stock is valued properly. |
Neutral |
| Price to Earnings: PE, the ratio for valuing a company that measures its current share price relative to its earnings per share (EPS). |
Neutral |
| Discounted cash flow: DCF, a valuation method used to estimate the value of an investment based on its expected future cash flows. |
Neutral |
| Return on Assets: ROA, indicates how profitable a company is in relation to its total assets, how efficiently uses assets to generate a profit. |
Outperform |
| Return on Equity: ROE, a measure of financial performance calculated by dividing net income by equity. a gauge of profitability and efficiency. |
Neutral |
| Debt to Equity: evaluate financial leverage, reflects the ability of equity to cover outstanding debts in the event of a business downturn. |
Neutral |
|
Exchange:
NYSE
|
|
|
Sector:
|
|
|
Industry:
|
|
| Shares Out | 129 (M) |
| Shares Float | 127 (M) |
| Held by Insiders | 1.2 (%) |
| Held by Institutions | 82.2 (%) |
| Shares Short | 1,150 (K) |
| Shares Short P.Month | 1,540 (K) |
| EPS | 4.34 |
| EPS Est Next Qtrly | 0 |
| EPS Est This Year | 0 |
| EPS Est Next Year | 0 |
| Book Value (p.s.) | 18.22 |
| Profit Margin | 7.6 % |
| Operating Margin | 6.5 % |
| Return on Assets (ttm) | 8.1 % |
| Return on Equity (ttm) | 25.4 % |
| Qtrly Rev. Growth | 0.4 % |
| Gross Profit (p.s.) | 0 |
| Sales Per Share | 57 |
| EBITDA (p.s.) | 7.84 |
| Qtrly Earnings Growth | 124.4 % |
| Operating Cash Flow | 1,260 (M) |
| Levered Free Cash Flow | 897 (M) |
| PE Ratio | 24.55 |
| PEG Ratio | 1.5 |
| Price to Book value | 5.84 |
| Price to Sales | 1.86 |
| Price to Cash Flow | 10.89 |
| Dividend | 0 |
| Forward Dividend | 0 |
| Dividend Yield | 0% |
| Dividend Pay Date | Invalid DateTime. |
| Ex-Dividend Date | Invalid DateTime. |

|

|
|

|
|
|
|
|
|