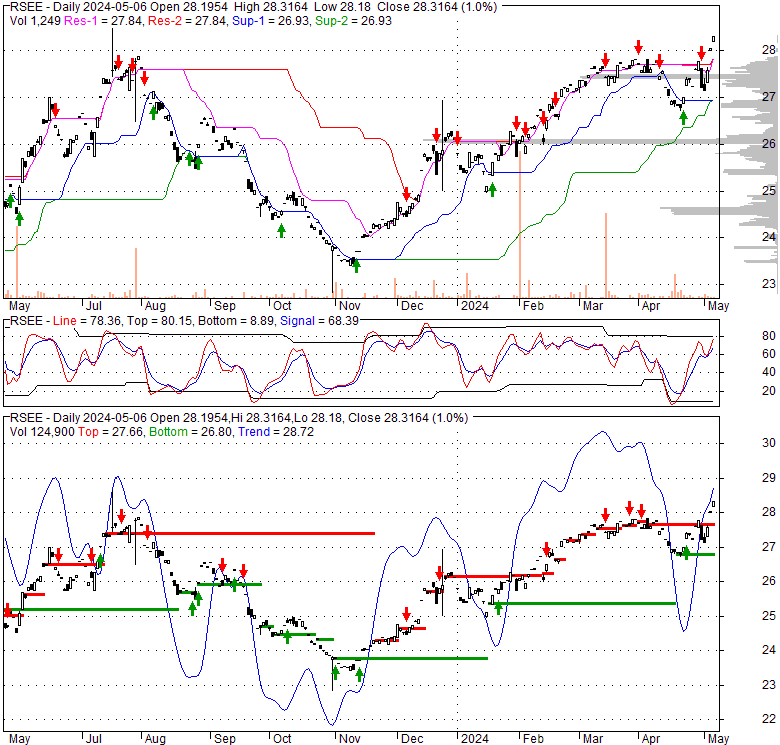
| 27.65 0.416 (1.53%) | 04-26 15:01 | |||||||||||||
|
|
| Short term | |
|||
| Mid term | ||||
| Targets | 6-month : | 32.51 |
1-year : | 37.97 |
| Resists | First : | 27.84 |
Second : | 32.51 |
| Pivot price | 27.25 |
|||
| Supports | First : | 27.15 |
Second : | 26.72 |
| MAs | MA(5) : | 27.34 |
MA(20) : | 27.34 |
| MA(100) : | 26.53 |
MA(250) : | 25.91 |
|
| MACD | MACD : | -0.1 |
Signal : | -0.1 |
| %K %D | K(14,3) : | 66.1 |
D(3) : | 57.7 |
| RSI | RSI(14): 58.3 |
|||
| 52-week | High : | 28.67 | Low : | 22.81 |
Price has closed above its short-term moving average. Short-term moving average is currently below mid-term; and above long-term moving average. From the relationship between price and moving averages: This stock is NEUTRAL in short-term; and NEUTRAL in mid-long term.[ RSEE ] has closed below upper band by 19.5%. Bollinger Bands are 16.2% wider than normal. The current width of the bands does not suggest anything about the future direction or movement of prices.
| If tomorrow: | Open lower | Open higher |
| High: | 27.26 - 27.44 | 27.44 - 27.59 |
| Low: | 26.85 - 27.03 | 27.03 - 27.18 |
| Close: | 26.97 - 27.26 | 27.26 - 27.51 |
The fund is an actively managed exchange-traded fund that seeks to achieve its investment objective by investing in exchange traded funds that primarily invest in equity securities of domestic, foreign or emerging market issuers of any market capitalization (“Underlying Equity ETFs”). In investing in Underlying Equity ETFs, the fund seeks investment exposure to one or more of the following equity sub-strategies: (1) U.S. Large Capitalization, (2) U.S. Small Capitalization, (3) Emerging Markets, or (4) Non-U.S. Developed Markets securities.
Thu, 25 Apr 2024
Webcast: Finding Optimal Market Exposures | ETF Trends - Advisor Perspectives
| Price to Book Value: P/BV, a ratio used to compare book value to its current market price, to gauge whether a stock is valued properly. |
Neutral |
| Price to Earnings: PE, the ratio for valuing a company that measures its current share price relative to its earnings per share (EPS). |
Neutral |
| Discounted cash flow: DCF, a valuation method used to estimate the value of an investment based on its expected future cash flows. |
Neutral |
| Return on Assets: ROA, indicates how profitable a company is in relation to its total assets, how efficiently uses assets to generate a profit. |
Neutral |
| Return on Equity: ROE, a measure of financial performance calculated by dividing net income by equity. a gauge of profitability and efficiency. |
Neutral |
| Debt to Equity: evaluate financial leverage, reflects the ability of equity to cover outstanding debts in the event of a business downturn. |
Neutral |
|
Exchange:
ETF
|
|
|
Sector:
Financial Services
|
|
|
Industry:
Asset Management
|
|
| Shares Out | 0 (M) |
| Shares Float | 0 (M) |
| Held by Insiders | 0 (%) |
| Held by Institutions | 0 (%) |
| Shares Short | 0 (K) |
| Shares Short P.Month | 0 (K) |
| EPS | 0 |
| EPS Est Next Qtrly | 0 |
| EPS Est This Year | 0 |
| EPS Est Next Year | 0 |
| Book Value (p.s.) | 0 |
| Profit Margin | 0 % |
| Operating Margin | 0 % |
| Return on Assets (ttm) | 0 % |
| Return on Equity (ttm) | 0 % |
| Qtrly Rev. Growth | 0 % |
| Gross Profit (p.s.) | 0 |
| Sales Per Share | 0 |
| EBITDA (p.s.) | 0 |
| Qtrly Earnings Growth | 0 % |
| Operating Cash Flow | 0 (M) |
| Levered Free Cash Flow | 0 (M) |
| PE Ratio | 0 |
| PEG Ratio | 0 |
| Price to Book value | 0 |
| Price to Sales | 0 |
| Price to Cash Flow | 0 |
| Dividend | 0 |
| Forward Dividend | 0 |
| Dividend Yield | 0% |
| Dividend Pay Date | Invalid DateTime. |
| Ex-Dividend Date | Invalid DateTime. |

|

|
|

|
|
|
|
|
|