
| 24.575 -0.07 (-0.29%) | 08-14 15:46 | |||||||||||||
|
|
| Short term |   |
|||
| Mid term |  |
|||
| Targets | 6-month : | 28.78 |
1-year : | 28.92 |
| Resists | First : | 24.64 |
Second : | 24.76 |
| Pivot price | 24.54  |
|||
| Supports | First : | 24.44 |
Second : | 20.33 |
| MAs | MA(5) : | 24.55 |
MA(20) : | 24.54 |
| MA(100) : | 24.66 |
MA(250) : | 24.6 |
|
| MACD | MACD : | -0.1 |
Signal : | -0.1 |
| %K %D | K(14,3) : | 64 |
D(3) : | 50.8 |
| RSI | RSI(14): 49.2 |
|||
| 52-week | High : | 25.06 | Low : | 23.93 |
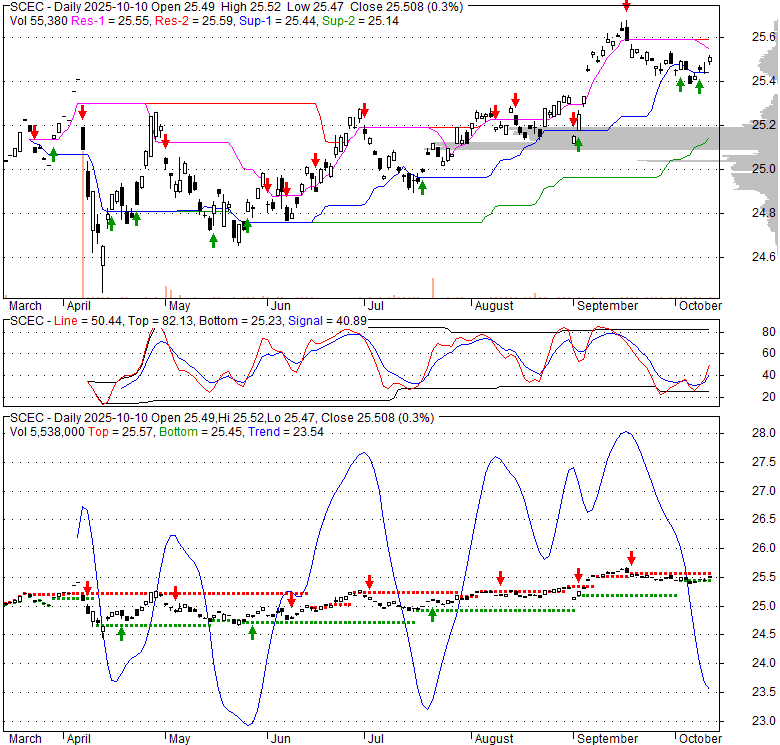
Price has closed above its short-term moving average. Short-term moving average is currently below mid-term; and below long-term moving average. From the relationship between price and moving averages: This stock is NEUTRAL in short-term; and NEUTRAL in mid-long term.[ SCEC ] has closed below upper band by 36.2%. Bollinger Bands are 28.8% narrower than normal. The current width of the bands does not suggest anything about the future direction or movement of prices.
| If tomorrow: | Open lower | Open higher |
| High: | 24.66 - 24.81 | 24.81 - 24.93 |
| Low: | 24.24 - 24.4 | 24.4 - 24.54 |
| Close: | 24.36 - 24.61 | 24.61 - 24.83 |
SCEC is core bond portfolio comprised of diversified USD-denominated securities, including foreign and emerging market debt. It primarily allocates at least 80% of its assets in investment-grade securities, allowing up to 20% in high-yield bonds. To maintain its diversified portfolio, the fund holds various securities including, but is not limited to, US government and corporate bonds, asset- and mortgage-backed securities, CLOs, and Muni bonds. It may also invest in preferred stock, restricted securities, and variable and floating rate instruments. As part of the strategy, the manager utilizes a top-down investment management approach, centering on interest rate risk, sector allocation, credit risk, and individual securities selection. Selection is dependent on valuations and potential risk of each security. The fund is actively managed. It may also use derivatives, including futures contracts, forward foreign currency contracts, credit default swaps, and interest rate swaps.
Fri, 23 May 2025
ETFGI reports assets invested in actively managed ETFs listed globally surged to a new all-time high of US$1.30 trillion at end of April - ETFGI
| Price to Book Value: P/BV, a ratio used to compare book value to its current market price, to gauge whether a stock is valued properly. |
Neutral |
| Price to Earnings: PE, the ratio for valuing a company that measures its current share price relative to its earnings per share (EPS). |
Neutral |
| Discounted cash flow: DCF, a valuation method used to estimate the value of an investment based on its expected future cash flows. |
Neutral |
| Return on Assets: ROA, indicates how profitable a company is in relation to its total assets, how efficiently uses assets to generate a profit. |
Neutral |
| Return on Equity: ROE, a measure of financial performance calculated by dividing net income by equity. a gauge of profitability and efficiency. |
Neutral |
| Debt to Equity: evaluate financial leverage, reflects the ability of equity to cover outstanding debts in the event of a business downturn. |
Neutral |
|
Exchange:
CBOE
|
|
|
Sector:
Financial Services
|
|
|
Industry:
Asset Management
|
|
| Shares Out | 0 (M) |
| Shares Float | 0 (M) |
| Held by Insiders | 0 (%) |
| Held by Institutions | 0 (%) |
| Shares Short | 0 (K) |
| Shares Short P.Month | 0 (K) |
| EPS | 0 |
| EPS Est Next Qtrly | 0 |
| EPS Est This Year | 0 |
| EPS Est Next Year | 0 |
| Book Value (p.s.) | 0 |
| Profit Margin | 0 % |
| Operating Margin | 0 % |
| Return on Assets (ttm) | 0 % |
| Return on Equity (ttm) | 0 % |
| Qtrly Rev. Growth | 0 % |
| Gross Profit (p.s.) | 0 |
| Sales Per Share | 0 |
| EBITDA (p.s.) | 0 |
| Qtrly Earnings Growth | 0 % |
| Operating Cash Flow | 0 (M) |
| Levered Free Cash Flow | 0 (M) |
| PE Ratio | 0 |
| PEG Ratio | 0 |
| Price to Book value | 0 |
| Price to Sales | 0 |
| Price to Cash Flow | 0 |
| Dividend | 0 |
| Forward Dividend | 0 |
| Dividend Yield | 0% |
| Dividend Pay Date | Invalid DateTime. |
| Ex-Dividend Date | Invalid DateTime. |

|

|
|

|
|
|
|
|
|