| 0 (0%) | 04-29 16:32 | |||||||||||||
|
|
| Short term | |
|||
| Mid term | |
|||
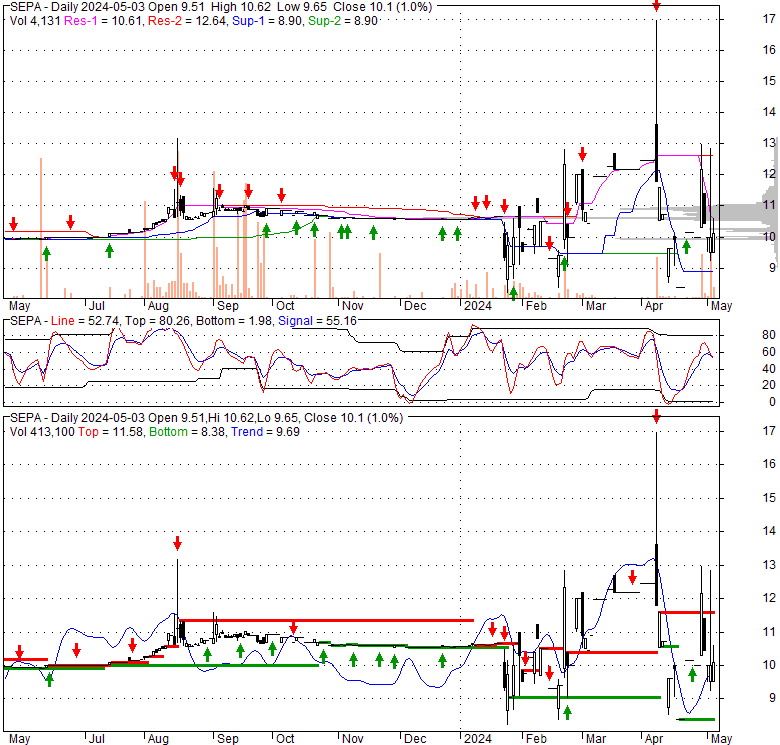
| Targets | 6-month : | 16 | 1-year : | 19.85 |
| Resists | First : | 13.7 | Second : | 17 |
| Pivot price | 10.75 |
|||
| Supports | First : | 8.38 | Second : | 6.97 |
| MAs | MA(5) : | 8.93 |
MA(20) : | 11.11 |
| MA(100) : | 10.75 |
MA(250) : | 10.53 |
|
| MACD | MACD : | -0.8 |
Signal : | -0.4 |
| %K %D | K(14,3) : | 0 |
D(3) : | 5.1 |
| RSI | RSI(14): 20.8 | |||
| 52-week | High : | 17 | Low : | 8.19 |
Price has closed below its short-term moving average. Short-term moving average is currently below mid-term; and below long-term moving average. From the relationship between price and moving averages: This stock is BEARISH in short-term; and NEUTRAL in mid-long term.[ SEPA ] has closed above bottom band by 11.8%. Bollinger Bands are 292.1% wider than normal. The large width of the bands suggest high volatility as compared to its normal range. The bands have been in this wide range for 6 days. This is a sign that the current trend might continue.
| If tomorrow: | Open lower | Open higher |
| High: | 8.39 - 8.43 | 8.43 - 8.46 |
| Low: | 8.28 - 8.32 | 8.32 - 8.37 |
| Close: | 8.3 - 8.38 | 8.38 - 8.44 |
Fri, 26 Apr 2024
SEPA Stock Quote Price and Forecast - CNN
Wed, 24 Apr 2024
Longtime Litigation Law Firm Closes as Partners Head to Sepa... - Law.com
Wed, 24 Apr 2024
Innovation, integration and independence: taking the Single Euro Payments Area to the next level - European Central Bank
Mon, 08 Apr 2024
Global Experts from SEPA Call for the Control of Gingivitis Rather than Waiting for Periodontitis to Develop - Yahoo Finance
Fri, 22 Mar 2024
Spectral AI secures portion of $30M SEPA funding - AuntMinnie
Fri, 15 Mar 2024
SEPA March - tricitiesbusinessnews.com
| Price to Book Value: P/BV, a ratio used to compare book value to its current market price, to gauge whether a stock is valued properly. |
Neutral |
| Price to Earnings: PE, the ratio for valuing a company that measures its current share price relative to its earnings per share (EPS). |
Neutral |
| Discounted cash flow: DCF, a valuation method used to estimate the value of an investment based on its expected future cash flows. |
Neutral |
| Return on Assets: ROA, indicates how profitable a company is in relation to its total assets, how efficiently uses assets to generate a profit. |
Neutral |
| Return on Equity: ROE, a measure of financial performance calculated by dividing net income by equity. a gauge of profitability and efficiency. |
Neutral |
| Debt to Equity: evaluate financial leverage, reflects the ability of equity to cover outstanding debts in the event of a business downturn. |
Neutral |
|
Exchange:
|
|
|
Sector:
|
|
|
Industry:
|
|
| Shares Out | 4 (M) |
| Shares Float | 1 (M) |
| Held by Insiders | 86.3 (%) |
| Held by Institutions | 6.9 (%) |
| Shares Short | 1 (K) |
| Shares Short P.Month | 3 (K) |
| EPS | -3.79 |
| EPS Est Next Qtrly | 0 |
| EPS Est This Year | 0 |
| EPS Est Next Year | 0 |
| Book Value (p.s.) | -0.64 |
| Profit Margin | 0 % |
| Operating Margin | 0 % |
| Return on Assets (ttm) | -9.6 % |
| Return on Equity (ttm) | 0 % |
| Qtrly Rev. Growth | 0 % |
| Gross Profit (p.s.) | 0 |
| Sales Per Share | 0 |
| EBITDA (p.s.) | 0 |
| Qtrly Earnings Growth | 0 % |
| Operating Cash Flow | -2 (M) |
| Levered Free Cash Flow | -10 (M) |
| PE Ratio | -2.22 |
| PEG Ratio | 0 |
| Price to Book value | -13.1 |
| Price to Sales | 0 |
| Price to Cash Flow | -17.42 |
| Dividend | 0 |
| Forward Dividend | 0 |
| Dividend Yield | 0% |
| Dividend Pay Date | Invalid DateTime. |
| Ex-Dividend Date | Invalid DateTime. |

|

|
|

|
|
|
|
|
|