| 0 (0%) | 04-19 23:13 | |||||||||||||
|
|
| Short term | |
|||
| Mid term | |
|||
| Targets | 6-month : | 28.84 |
1-year : | 33.69 |
| Resists | First : | 24.7 |
Second : | 28.84 |
| Pivot price | 21.53 |
|||
| Supports | First : | 21.47 |
Second : | 19.47 |
| MAs | MA(5) : | 21.62 |
MA(20) : | 21.59 |
| MA(100) : | 20.13 |
MA(250) : | 12.44 |
|
| MACD | MACD : | -0.3 |
Signal : | -0.5 |
| %K %D | K(14,3) : | 74.8 |
D(3) : | 63.1 |
| RSI | RSI(14): 54.1 |
|||
| 52-week | High : | 27.71 | Low : | 4.54 |
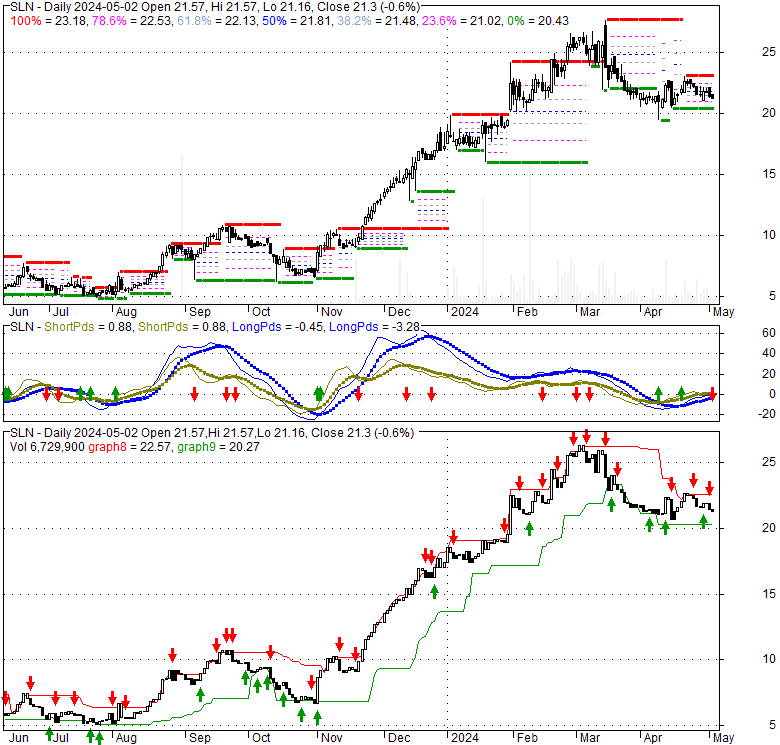
Price has closed above its short-term moving average. Short-term moving average is currently below mid-term; and above long-term moving average. From the relationship between price and moving averages: This stock is NEUTRAL in short-term; and NEUTRAL in mid-long term.[ SLN ] has closed Bollinger Bands are 49.9% narrower than normal. The narrow width of the bands suggests low volatility as compared to its normal range. The bands have been in this narrow range for 7 bars. This is a sign that the market may be about to initiate a new trend.
| If tomorrow: | Open lower | Open higher |
| High: | 23.18 - 23.26 | 23.26 - 23.34 |
| Low: | 21.54 - 21.64 | 21.64 - 21.73 |
| Close: | 22.48 - 22.62 | 22.62 - 22.75 |
Sun, 31 Mar 2024
Skyline Investments Reports Full Year 2023 Earnings - Simply Wall St
Tue, 14 Dec 2021
Best Hindi Web Series 2021 - India Today
Mon, 19 Mar 2018
Cancer Research Focuses on Growing Tumor Cells Outside the Human Body - newportri.com
Mon, 08 Jan 2018
Seizure audio comes - Kannada News - Telugu Cinema - IndiaGlitz
Wed, 30 Dec 2015
Alex Shnaider buys 21% stake in Mishorim - Globes - Globes
| Price to Book Value: P/BV, a ratio used to compare book value to its current market price, to gauge whether a stock is valued properly. |
Neutral |
| Price to Earnings: PE, the ratio for valuing a company that measures its current share price relative to its earnings per share (EPS). |
Neutral |
| Discounted cash flow: DCF, a valuation method used to estimate the value of an investment based on its expected future cash flows. |
Neutral |
| Return on Assets: ROA, indicates how profitable a company is in relation to its total assets, how efficiently uses assets to generate a profit. |
Neutral |
| Return on Equity: ROE, a measure of financial performance calculated by dividing net income by equity. a gauge of profitability and efficiency. |
Neutral |
| Debt to Equity: evaluate financial leverage, reflects the ability of equity to cover outstanding debts in the event of a business downturn. |
Neutral |
|
Exchange:
|
|
|
Sector:
|
|
|
Industry:
|
|
| Shares Out | 47 (M) |
| Shares Float | 73 (M) |
| Held by Insiders | 17 (%) |
| Held by Institutions | 44.5 (%) |
| Shares Short | 93 (K) |
| Shares Short P.Month | 46 (K) |
| EPS | -1.47 |
| EPS Est Next Qtrly | 0 |
| EPS Est This Year | 0 |
| EPS Est Next Year | 0 |
| Book Value (p.s.) | 0.43 |
| Profit Margin | -170.6 % |
| Operating Margin | -633.6 % |
| Return on Assets (ttm) | -30.8 % |
| Return on Equity (ttm) | -221.2 % |
| Qtrly Rev. Growth | -56 % |
| Gross Profit (p.s.) | 0 |
| Sales Per Share | 0.54 |
| EBITDA (p.s.) | -1.06 |
| Qtrly Earnings Growth | 0 % |
| Operating Cash Flow | -39 (M) |
| Levered Free Cash Flow | -23 (M) |
| PE Ratio | -15.51 |
| PEG Ratio | 0 |
| Price to Book value | 52.65 |
| Price to Sales | 41.47 |
| Price to Cash Flow | -26.76 |
| Dividend | 0 |
| Forward Dividend | 0 |
| Dividend Yield | 0% |
| Dividend Pay Date | Invalid DateTime. |
| Ex-Dividend Date | Invalid DateTime. |

|

|
|

|
|
|
|
|
|