
| 14.74 1.21 (8.94%) | 09-01 16:00 | |||||||||||||
|
|
| Short term |   |
|||
| Mid term |  |
|||
| Targets | 6-month : | 20.52 |
1-year : | 23.97 |
| Resists | First : | 17.57 |
Second : | 20.52 |
| Pivot price | 13.69 |
|||
| Supports | First : | 13.09 |
Second : | 10.31 |
| MAs | MA(5) : | 13.73 |
MA(20) : | 13.52 |
| MA(100) : | 9.28 |
MA(250) : | 7.22 |
|
| MACD | MACD : | 0.6 |
Signal : | 0.7  |
| %K %D | K(14,3) : | 33.7 |
D(3) : | 25.3 |
| RSI | RSI(14): 65.8 |
|||
| 52-week | High : | 17.57 | Low : | 4.19 |
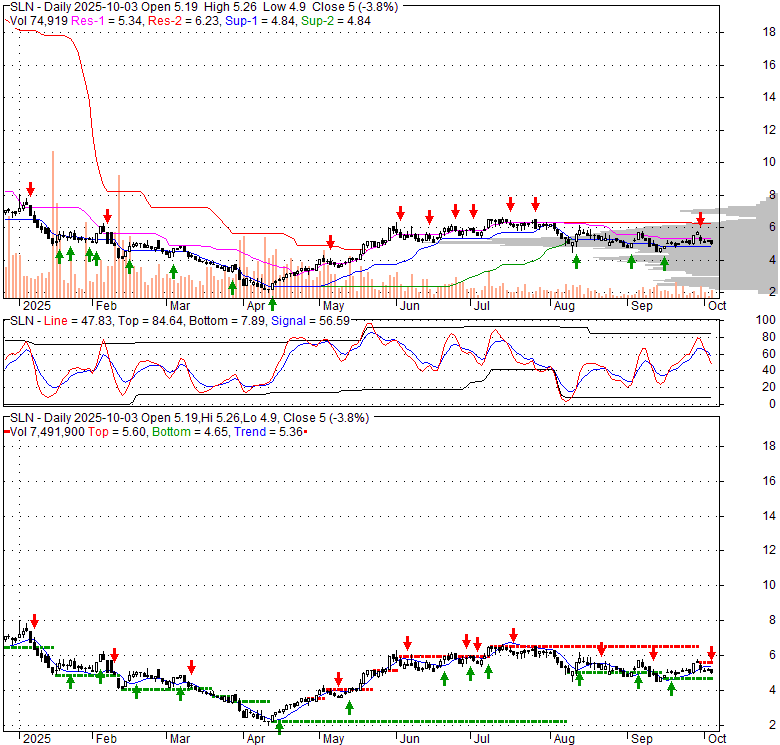
Price has closed above its short-term moving average. Short-term moving average is currently above mid-term; and above long-term moving average. From the relationship between price and moving averages: This stock is BULLISH in short-term; and BULLISH in mid-long term.[ SLN ] has closed above the upper band by 12.9%. If price is in a uptrend band; this upward trend in price might continue. However a short term pullback inside the band is likely.Bollinger Bands are 44.8% narrower than normal. The narrow width of the bands suggests low volatility as compared to its normal range. The bands have been in this narrow range for 1 bars. This is a sign that the market may be about to initiate a new trend.
| If tomorrow: | Open lower | Open higher |
| High: | 14.92 - 14.99 | 14.99 - 15.05 |
| Low: | 13.1 - 13.17 | 13.17 - 13.24 |
| Close: | 14.6 - 14.74 | 14.74 - 14.86 |
Silence Therapeutics plc is a London, UK-based biotechnology company specializing in the research and development of groundbreaking ribonucleic acid (RNA) therapeutics. Its therapeutic focus areas include hematological, cardiovascular, and various rare and metabolic conditions. Central to their innovative approach is the mRNAi GalNAc Oligonucleotide Discovery platform, which is designed for precise targeting of specific disease-causing genes within the liver. The company's methodology harnesses the body's natural RNA interference (RNAi) mechanism by designing short interfering RNA (siRNA) molecules that degrade messenger RNA (mRNA), thereby preventing the production of targeted disease-associated proteins. Their pipeline features several promising candidates, including SLN360, currently in Phase I clinical trials for cardiovascular disease associated with elevated lipoprotein. Another key candidate, SLN124, is undergoing Phase I clinical trials for non-transfusion-dependent thalassemia and myelodysplastic syndrome, with further development planned for polycythemia vera. Silence Therapeutics also engages in strategic collaborations to expand its reach. It has agreements with AstraZeneca PLC to discover, develop, and commercialize siRNA therapeutics for cardiovascular, renal, metabolic, and respiratory diseases. Furthermore, a partnership with Mallinckrodt Pharma IP Trading DAC aims to develop and commercialize RNAi drug targets designed to silence the complement cascade in complement-mediated disorders. The company is also collaborating with Hansoh Pharmaceutical Group Company Limited to develop siRNAs for three unspecified targets, utilizing Silence's mRNAi GOLD platform. Originally incorporated as SR Pharma plc, the company rebranded to Silence Therapeutics plc in May 2007.
Wed, 19 Aug 2026
SLN SEC Filings - Silence Therapeutics plc 10-K, 10-Q, 8-K Forms - Stock Titan
Wed, 19 Aug 2026
Silence Therapeutics: Making Some Recent Noise (NASDAQ:SLN) - seekingalpha.com
Thu, 13 Aug 2026
Wall Street Analysts Predict a 140.06% Upside in Silence Therapeutics (SLN): Here's What You Should Know - Yahoo Finance
Tue, 11 Aug 2026
Silence Therapeutics Announces Pricing of Upsized $175 Million Underwritten Public Offering - Business Wire
Mon, 10 Aug 2026
Silence Therapeutics (SLN) halves net loss and boosts cash in Q2 2026 - Stock Titan
| Price to Book Value: P/BV, a ratio used to compare book value to its current market price, to gauge whether a stock is valued properly. |
Underperform |
| Price to Earnings: PE, the ratio for valuing a company that measures its current share price relative to its earnings per share (EPS). |
Underperform |
| Discounted cash flow: DCF, a valuation method used to estimate the value of an investment based on its expected future cash flows. |
Neutral |
| Return on Assets: ROA, indicates how profitable a company is in relation to its total assets, how efficiently uses assets to generate a profit. |
Underperform |
| Return on Equity: ROE, a measure of financial performance calculated by dividing net income by equity. a gauge of profitability and efficiency. |
Underperform |
| Debt to Equity: evaluate financial leverage, reflects the ability of equity to cover outstanding debts in the event of a business downturn. |
Outperform |
|
Exchange:
NASDAQ
|
|
|
Sector:
Healthcare
|
|
|
Industry:
Biotechnology
|
|
| Shares Out | 0 (M) |
| Shares Float | 62 (M) |
| Held by Insiders | 3.784e+007 (%) |
| Held by Institutions | 7.9 (%) |
| Shares Short | 1,730 (K) |
| Shares Short P.Month | 0 (K) |
| EPS | -6.394e+007 |
| EPS Est Next Qtrly | 0 |
| EPS Est This Year | 0 |
| EPS Est Next Year | 0 |
| Book Value (p.s.) | 0 |
| Profit Margin | 0 % |
| Operating Margin | -10 % |
| Return on Assets (ttm) | 475.6 % |
| Return on Equity (ttm) | -29.7 % |
| Qtrly Rev. Growth | 615000 % |
| Gross Profit (p.s.) | 0 |
| Sales Per Share | -64.13 |
| EBITDA (p.s.) | 374468 |
| Qtrly Earnings Growth | -1.3 % |
| Operating Cash Flow | 0 (M) |
| Levered Free Cash Flow | -42 (M) |
| PE Ratio | -0.01 |
| PEG Ratio | 0 |
| Price to Book value | 0 |
| Price to Sales | -0.23 |
| Price to Cash Flow | 25.65 |
| Dividend | 0 |
| Forward Dividend | 1.84e+006 |
| Dividend Yield | 0% |
| Dividend Pay Date | Invalid DateTime. |
| Ex-Dividend Date | Invalid DateTime. |

|

|
|

|
|
|
|
|
|