| 0 (0%) | 04-25 00:33 | |||||||||||||
|
|
| Short term | |
|||
| Mid term | ||||
| Targets | 6-month : | 3.81 | 1-year : | 4.09 |
| Resists | First : | 3.26 | Second : | 3.5 |
| Pivot price | 3.2 |
|||
| Supports | First : | 2.88 | Second : | 2.39 |
| MAs | MA(5) : | 3.08 |
MA(20) : | 3.2 |
| MA(100) : | 2.97 |
MA(250) : | 3.51 |
|
| MACD | MACD : | 0 |
Signal : | 0 |
| %K %D | K(14,3) : | 13.9 |
D(3) : | 17 |
| RSI | RSI(14): 45.1 |
|||
| 52-week | High : | 5.42 | Low : | 2.31 |
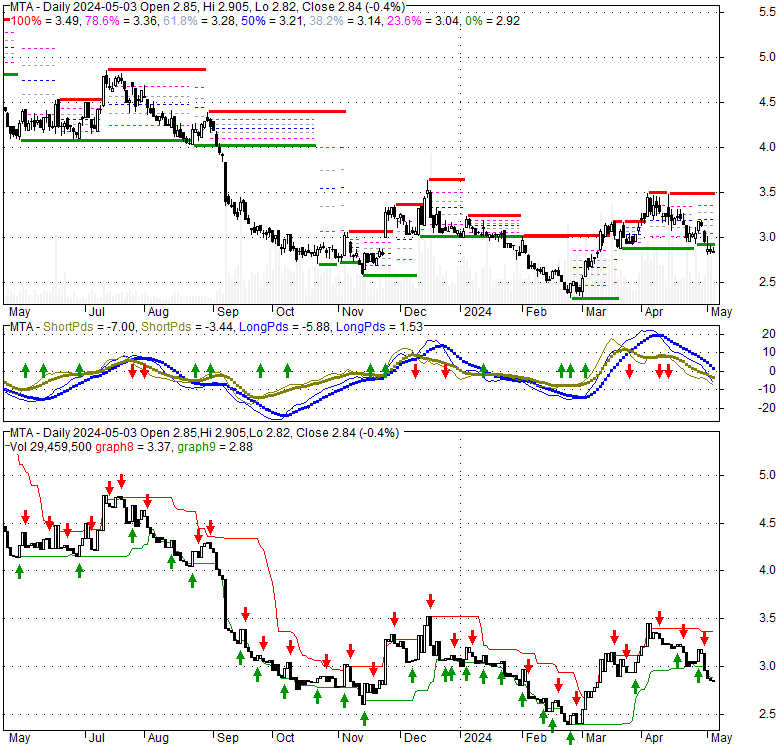
Price has closed below its short-term moving average. Short-term moving average is currently above mid-term; and above long-term moving average. From the relationship between price and moving averages: This stock is NEUTRAL in short-term; and NEUTRAL in mid-long term.[ MTA ] has closed above bottom band by 8.0%. Bollinger Bands are 21.4% narrower than normal. The current width of the bands does not suggest anything about the future direction or movement of prices.
| If tomorrow: | Open lower | Open higher |
| High: | 3.07 - 3.09 | 3.09 - 3.1 |
| Low: | 2.94 - 2.96 | 2.96 - 2.98 |
| Close: | 2.99 - 3.03 | 3.03 - 3.06 |
Wed, 24 Apr 2024
SMTA Capital Chapter's Expo and Tech Forum to be Held on May 23 - I-Connect007
Wed, 24 Apr 2024
LA/Orange County SMTA Tech Expo a Success - I-Connect007
Wed, 24 Apr 2024
Women's Leadership Program at SMTA International 2023 - I-Connect007
Tue, 23 Apr 2024
Meet the KYZEN Clean Team in Mexico at SMTA Juarez and SMTA Tijuana - I-Connect007
Fri, 19 Apr 2024
Practical Components Adds SMTA Solder Paste Test Vehicle for Miniaturized SMT - I-Connect007
Sat, 13 Apr 2024
Introducing the SMTA International Technical Program for Advancing Electronics Manufacturing - I-Connect007
| Price to Book Value: P/BV, a ratio used to compare book value to its current market price, to gauge whether a stock is valued properly. |
Neutral |
| Price to Earnings: PE, the ratio for valuing a company that measures its current share price relative to its earnings per share (EPS). |
Neutral |
| Discounted cash flow: DCF, a valuation method used to estimate the value of an investment based on its expected future cash flows. |
Outperform |
| Return on Assets: ROA, indicates how profitable a company is in relation to its total assets, how efficiently uses assets to generate a profit. |
Neutral |
| Return on Equity: ROE, a measure of financial performance calculated by dividing net income by equity. a gauge of profitability and efficiency. |
Outperform |
| Debt to Equity: evaluate financial leverage, reflects the ability of equity to cover outstanding debts in the event of a business downturn. |
Underperform |
|
Exchange:
|
|
|
Sector:
|
|
|
Industry:
|
|
| Shares Out | 90 (M) |
| Shares Float | 40 (M) |
| Held by Insiders | 23.9 (%) |
| Held by Institutions | 14.2 (%) |
| Shares Short | 2,060 (K) |
| Shares Short P.Month | 1,920 (K) |
| EPS | -0.19 |
| EPS Est Next Qtrly | 0 |
| EPS Est This Year | 0 |
| EPS Est Next Year | 0 |
| Book Value (p.s.) | 2.47 |
| Profit Margin | -223 % |
| Operating Margin | -67.8 % |
| Return on Assets (ttm) | -2.6 % |
| Return on Equity (ttm) | -7.7 % |
| Qtrly Rev. Growth | 107.1 % |
| Gross Profit (p.s.) | 0 |
| Sales Per Share | 0.04 |
| EBITDA (p.s.) | -0.04 |
| Qtrly Earnings Growth | 0 % |
| Operating Cash Flow | 1 (M) |
| Levered Free Cash Flow | -5 (M) |
| PE Ratio | -16.84 |
| PEG Ratio | 0 |
| Price to Book value | 1.22 |
| Price to Sales | 69.05 |
| Price to Cash Flow | 246.72 |
| Dividend | 0 |
| Forward Dividend | 0 |
| Dividend Yield | 0% |
| Dividend Pay Date | Invalid DateTime. |
| Ex-Dividend Date | Invalid DateTime. |

|

|
|

|
|
|
|
|
|