
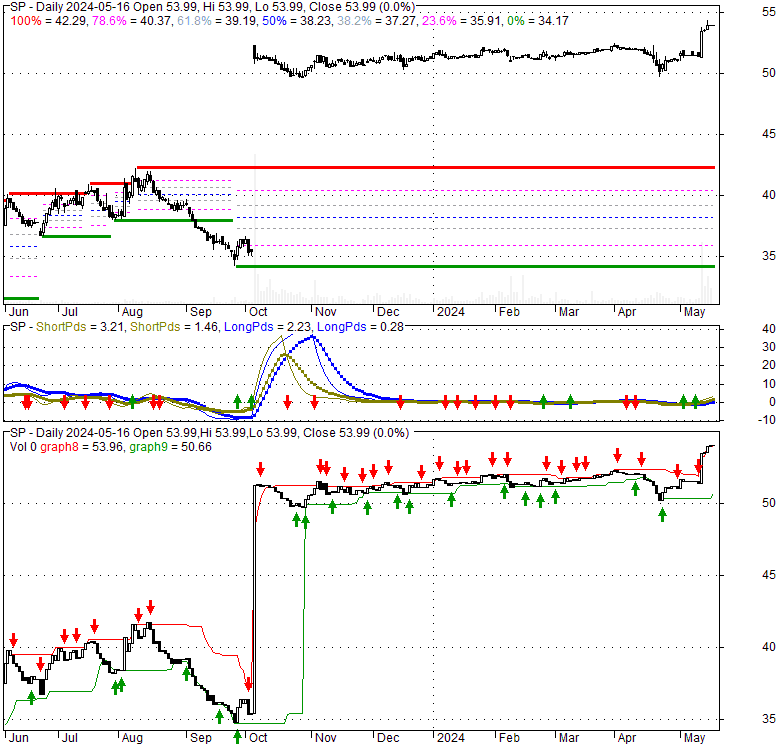
| 53.99 0.02 (0.04%) | 05-15 16:00 | |||||||||||||
|
|
| Short term |  |
|||
| Mid term | |
|||
| Targets | 6-month : | 1-year : | ||
| Resists | First : | Second : | ||
| Pivot price | ||||
| Supports | First : | Second : | ||
| MAs | MA(5) : | MA(20) : | ||
| MA(100) : | MA(250) : | |||
| MACD | MACD : | Signal : | ||
| %K %D | K(14,3) : | D(3) : | ||
| RSI | RSI(14): | |||
| 52-week | High : | Low : | ||
| If tomorrow: | Open lower | Open higher |
| High: | - | - |
| Low: | - | - |
| Close: | - | - |
SP Plus Corporation, established in Chicago, Illinois in 1929, delivers a wide array of mobility and ancillary services across North America. The company's operations are divided into Commercial and Aviation divisions. Their comprehensive offerings include managing on-site parking and valet services, coordinating ground transportation with shuttle vehicles and drivers, and overseeing event logistics. They also provide facility maintenance, such as power sweeping, washing, painting, and general repairs, along with consulting for parking operations, and municipal meter collection and enforcement. For the travel industry, SP Plus offers extensive baggage services, encompassing the delivery of delayed luggage, general baggage handling, wheelchair assistance, and repair or replacement services. Beyond these core functions, the company provides security services, which include the deployment of trained personnel, patrols, and integrated technological solutions. They also operate consumer-facing digital platforms, such as the parking.com website and mobile applications. Additionally, SP Plus assists clients with multi-channel marketing initiatives, utilizing its SP+-branded websites, search engine marketing, email campaigns, and social media. The company's services are marketed under key brands like SP+, Sphere, and Bags. Their diverse clientele spans private and public entities, local governments, and developers and managers of various properties, including corporate offices, residential buildings, retail centers, sports complexes, hotels, and healthcare facilities, as well as airlines and cruise lines. Known as Standard Parking Corporation until December 2013, the company subsequently rebranded as SP Plus Corporation.
Mon, 27 Jul 2026
Jackson to hold off on canceling parking meter contract - WLBT
Mon, 12 Jan 2026
Metropolis settles state probe, will offer credits for free parking - The Business Journals
Tue, 02 Dec 2025
Great Falls to hike parking fees, fines to close budget gap while bigger changes loom - Montana Free Press
Thu, 16 Oct 2025
Parking tech firm moving to Fulton Market, cutting space - Crain's Chicago Business
Fri, 24 May 2024
Metropolis Technologies: AI-Based Checkout-Free Payment Company Raises $1.8 Billion - Pulse 2.0
Thu, 16 May 2024
How AI is disrupting parking - Axios
| Price to Book Value: P/BV, a ratio used to compare book value to its current market price, to gauge whether a stock is valued properly. |
Outperform |
| Price to Earnings: PE, the ratio for valuing a company that measures its current share price relative to its earnings per share (EPS). |
Outperform |
| Discounted cash flow: DCF, a valuation method used to estimate the value of an investment based on its expected future cash flows. |
Outperform |
| Return on Assets: ROA, indicates how profitable a company is in relation to its total assets, how efficiently uses assets to generate a profit. |
Neutral |
| Return on Equity: ROE, a measure of financial performance calculated by dividing net income by equity. a gauge of profitability and efficiency. |
Outperform |
| Debt to Equity: evaluate financial leverage, reflects the ability of equity to cover outstanding debts in the event of a business downturn. |
Outperform |
|
Exchange:
NASDAQ
|
|
|
Sector:
Industrials
|
|
|
Industry:
Specialty Business Services
|
|
| Shares Out | 0 (M) |
| Shares Float | 0 (M) |
| Held by Insiders | (%) |
| Held by Institutions | (%) |
| Shares Short | 0 (K) |
| Shares Short P.Month | 0 (K) |
| EPS | |
| EPS Est Next Qtrly | |
| EPS Est This Year | |
| EPS Est Next Year | |
| Book Value (p.s.) | |
| Profit Margin | % |
| Operating Margin | % |
| Return on Assets (ttm) | % |
| Return on Equity (ttm) | % |
| Qtrly Rev. Growth | % |
| Gross Profit (p.s.) | |
| Sales Per Share | |
| EBITDA (p.s.) | |
| Qtrly Earnings Growth | % |
| Operating Cash Flow | 0 (M) |
| Levered Free Cash Flow | 0 (M) |
| PE Ratio | |
| PEG Ratio | |
| Price to Book value | |
| Price to Sales | |
| Price to Cash Flow |
| Dividend | |
| Forward Dividend | |
| Dividend Yield | 0% |
| Dividend Pay Date | |
| Ex-Dividend Date |

|

|
|

|
|
|
|
|
|