
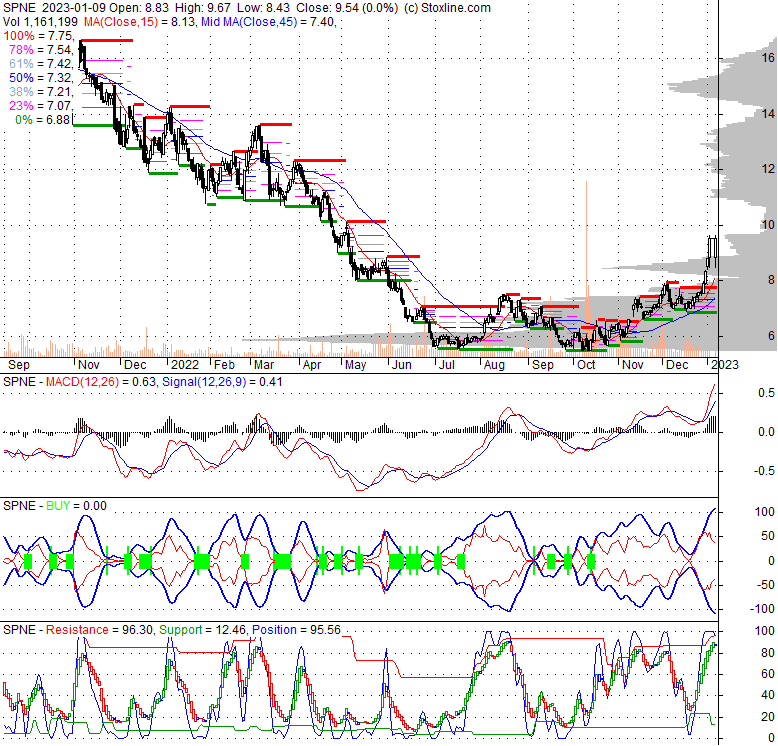
| 9.54 0.73 (8.29%) | 01-04 16:00 | |||||||||||||
|
|
| Short term |  |
|||
| Mid term | |
|||
| Targets | 6-month : | 1-year : | ||
| Resists | First : | Second : | ||
| Pivot price | ||||
| Supports | First : | Second : | ||
| MAs | MA(5) : | MA(20) : | ||
| MA(100) : | MA(250) : | |||
| MACD | MACD : | Signal : | ||
| %K %D | K(14,3) : | D(3) : | ||
| RSI | RSI(14): | |||
| 52-week | High : | Low : | ||
| If tomorrow: | Open lower | Open higher |
| High: | - | - |
| Low: | - | - |
| Close: | - | - |
SeaSpine Holdings Corporation is a medical technology firm specializing in the creation, development, and global marketing of advanced surgical solutions for treating spinal disorders. The company offers an extensive portfolio of orthobiologics and spinal implant systems, which are primarily utilized by neurosurgeons and orthopedic spine specialists to perform spinal fusion procedures in the cervical, thoracic, and lumbar regions. Their orthobiologic product line features various bone graft substitutes, including demineralized bone matrix (DBM), collagen ceramic matrices, demineralized cancellous allografts, and synthetic bone void fillers. These materials are engineered to improve bone fusion rates in a wide array of orthopedic operations, extending beyond the spine to include hip and extremity procedures. These orthobiologics are available in diverse forms such as fibers, putties, pastes, strips, and DBM. Furthermore, SeaSpine provides implantable devices designed for spinal decompression, alignment correction, and stabilization. Complementing these, the company offers sophisticated image-guided surgical solutions, including a dedicated surgical navigation system. This system is instrumental in facilitating fusion during complex procedures for degenerative conditions, minimally invasive interventions, and severe spinal deformities across the entire spinal column. Established in 2015, SeaSpine Holdings Corporation is headquartered in Carlsbad, California.
Tue, 10 Jan 2023
Orthofix Medical Completes Merger with SeaSpine Holdings Corp. - Dallas Innovates
Wed, 04 Jan 2023
Orthofix and SeaSpine Announce Completion of Merger of Equals to Create a Leading Global Spine and Orthopedics Company - Business Wire
Tue, 11 Oct 2022
Orthofix and SeaSpine to Combine in Merger of Equals to Create Leading Global Spine and Orthopedics Company - Business Wire
Tue, 11 Oct 2022
Orthofix, SeaSpine announce merger to create new orthopedics, spine company - Healio
Tue, 19 Jul 2022
SeaSpine Announces Three-Year Extension and Expansion of $30 Million Credit Facility - Ortho Spine News
Tue, 21 Jun 2022
SeaSpine® Announces Full Commercial Launch of WaveForm® C 3D-printed Interbody System - Ortho Spine News
| Price to Book Value: P/BV, a ratio used to compare book value to its current market price, to gauge whether a stock is valued properly. |
Outperform |
| Price to Earnings: PE, the ratio for valuing a company that measures its current share price relative to its earnings per share (EPS). |
Underperform |
| Discounted cash flow: DCF, a valuation method used to estimate the value of an investment based on its expected future cash flows. |
Outperform |
| Return on Assets: ROA, indicates how profitable a company is in relation to its total assets, how efficiently uses assets to generate a profit. |
Neutral |
| Return on Equity: ROE, a measure of financial performance calculated by dividing net income by equity. a gauge of profitability and efficiency. |
Neutral |
| Debt to Equity: evaluate financial leverage, reflects the ability of equity to cover outstanding debts in the event of a business downturn. |
Neutral |
|
Exchange:
NASDAQ
|
|
|
Sector:
Healthcare
|
|
|
Industry:
Medical - Devices
|
|
| Shares Out | 0 (M) |
| Shares Float | 0 (M) |
| Held by Insiders | (%) |
| Held by Institutions | (%) |
| Shares Short | 0 (K) |
| Shares Short P.Month | 0 (K) |
| EPS | |
| EPS Est Next Qtrly | |
| EPS Est This Year | |
| EPS Est Next Year | |
| Book Value (p.s.) | |
| Profit Margin | % |
| Operating Margin | % |
| Return on Assets (ttm) | % |
| Return on Equity (ttm) | % |
| Qtrly Rev. Growth | % |
| Gross Profit (p.s.) | |
| Sales Per Share | |
| EBITDA (p.s.) | |
| Qtrly Earnings Growth | % |
| Operating Cash Flow | 0 (M) |
| Levered Free Cash Flow | 0 (M) |
| PE Ratio | |
| PEG Ratio | |
| Price to Book value | |
| Price to Sales | |
| Price to Cash Flow |
| Dividend | |
| Forward Dividend | |
| Dividend Yield | 0% |
| Dividend Pay Date | |
| Ex-Dividend Date |

|

|

|

|
|
|
|
|
|