| 0 (0%) | 04-25 13:57 | |||||||||||||
|
|
| Short term | |
|||
| Mid term | ||||
| Targets | 6-month : | 6.21 |
1-year : | 6.92 |
| Resists | First : | 5.32 |
Second : | 5.92 |
| Pivot price | 5.24 |
|||
| Supports | First : | 4.34 |
Second : | 3.61 |
| MAs | MA(5) : | 4.93 |
MA(20) : | 5.14 |
| MA(100) : | 4.8 |
MA(250) : | 5.8 |
|
| MACD | MACD : | 0 |
Signal : | 0.1 |
| %K %D | K(14,3) : | 12 |
D(3) : | 15.7 |
| RSI | RSI(14): 45.5 |
|||
| 52-week | High : | 9.88 | Low : | 3.84 |
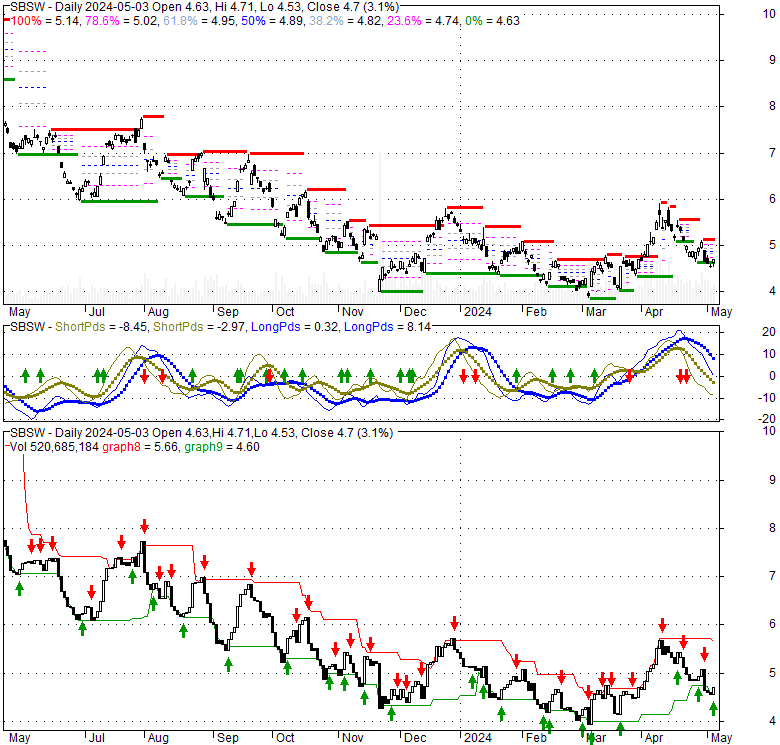
Price has closed below its short-term moving average. Short-term moving average is currently above mid-term; and above long-term moving average. From the relationship between price and moving averages: This stock is NEUTRAL in short-term; and NEUTRAL in mid-long term.[ SBSW ] has closed above bottom band by 9.8%. Bollinger Bands are 0.9% wider than normal. The current width of the bands does not suggest anything about the future direction or movement of prices.
| If tomorrow: | Open lower | Open higher |
| High: | 4.9 - 4.93 | 4.93 - 4.96 |
| Low: | 4.65 - 4.69 | 4.69 - 4.73 |
| Close: | 4.82 - 4.88 | 4.88 - 4.94 |
Mon, 22 Apr 2024
Prof. Gómez Joins Alum Kenyora Parham (SSW'12) & #MeToo Founder Tarana Burke on Board of End Rape on Campus - Boston University
Mon, 22 Apr 2024
Water main break destroys portion of road off SSW Loop 323 in Tyler - KLTV
Mon, 22 Apr 2024
Water main break forces boil notice for some Tyler residents - KLTV
Fri, 19 Apr 2024
Fans Deem Nick Davis Only Successful ‘Ssw’ Polygamist - imdb
Thu, 18 Apr 2024
Robert Hawkins named new SSW vice dean | UNC-Chapel Hill - The University of North Carolina at Chapel Hill
Wed, 17 Apr 2024
Zambia visit shows SSW's global impact | UNC-Chapel Hill - The University of North Carolina at Chapel Hill
| Price to Book Value: P/BV, a ratio used to compare book value to its current market price, to gauge whether a stock is valued properly. |
Outperform |
| Price to Earnings: PE, the ratio for valuing a company that measures its current share price relative to its earnings per share (EPS). |
Outperform |
| Discounted cash flow: DCF, a valuation method used to estimate the value of an investment based on its expected future cash flows. |
Outperform |
| Return on Assets: ROA, indicates how profitable a company is in relation to its total assets, how efficiently uses assets to generate a profit. |
Neutral |
| Return on Equity: ROE, a measure of financial performance calculated by dividing net income by equity. a gauge of profitability and efficiency. |
Neutral |
| Debt to Equity: evaluate financial leverage, reflects the ability of equity to cover outstanding debts in the event of a business downturn. |
Outperform |
|
Exchange:
|
|
|
Sector:
|
|
|
Industry:
|
|
| Shares Out | 708 (M) |
| Shares Float | 2,290 (M) |
| Held by Insiders | 0 (%) |
| Held by Institutions | 14.6 (%) |
| Shares Short | 19,650 (K) |
| Shares Short P.Month | 22,030 (K) |
| EPS | 1.01 |
| EPS Est Next Qtrly | 0 |
| EPS Est This Year | 0 |
| EPS Est Next Year | 0 |
| Book Value (p.s.) | 17.21 |
| Profit Margin | -33.3 % |
| Operating Margin | -91.5 % |
| Return on Assets (ttm) | -16.1 % |
| Return on Equity (ttm) | -52.5 % |
| Qtrly Rev. Growth | -21.8 % |
| Gross Profit (p.s.) | 0 |
| Sales Per Share | 160.64 |
| EBITDA (p.s.) | -42.15 |
| Qtrly Earnings Growth | 0 % |
| Operating Cash Flow | 12,410 (M) |
| Levered Free Cash Flow | -39,560 (M) |
| PE Ratio | 4.73 |
| PEG Ratio | 0 |
| Price to Book value | 0.28 |
| Price to Sales | 0.03 |
| Price to Cash Flow | 0.27 |
| Dividend | 0 |
| Forward Dividend | 0 |
| Dividend Yield | 0% |
| Dividend Pay Date | Invalid DateTime. |
| Ex-Dividend Date | Invalid DateTime. |

|

|
|

|
|
|
|
|
|