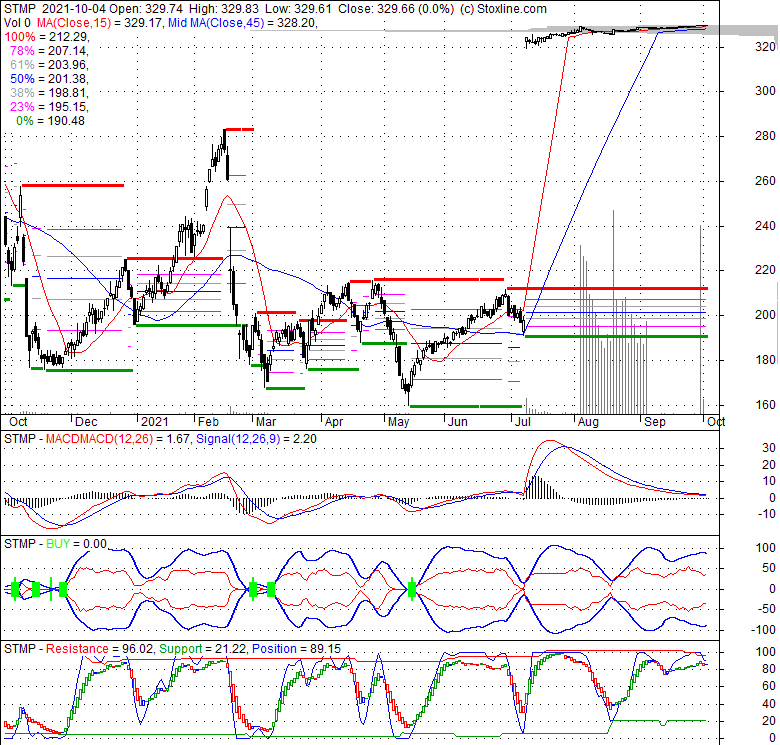
Stamps.com Inc (STMP) |
240.69 3.09 (1.3%)
|
01-27 03:23 |
Open: |
237.5 |
Pre. Close: |
237.6 |
High:
|
240.865 |
Low:
|
232.86 |
Volume:
|
238,559 |
Market Cap:
|
4,389M |
|
|
Stamps.com Inc. provides Internet-based mailing and shipping solutions in the United States and Europe. It operates through Stamps.com and MetaPack segments. The company offers mailing and shipping solutions to mail and ship various mail pieces and packages through the United States Postal Service (USPS) under the Stamps.com, Endicia, ShipEngine, ShipStation, ShipWorks, and ShippingEasy brands. Its solutions support various USPS mail classes, including First Class Mail, Priority Mail, Priority Mail Express, Media Mail, Parcel Select, and others. The company's USPS mailing and shipping solutions enable users to print electronic postage directly onto envelopes, postcards, or labels using personal computing device, printer, and Internet connection. It also provides multi carrier shipping solutions under the MetaPack brand; mailing and shipping integration solutions comprising electronic postage for transactions to partners who manage the front-end process; branded insurance to insure mails or packages; and international postage solutions. In addition, the company offers customized postage solutions under the PhotoStamps brand, which allow consumers to turn digital photos, designs, or images into USPS-approved postage; and sells NetStamps labels, shipping labels, mailing labels, postage printers, scales, and other mailing and shipping-focused office supplies through its mailing and shipping supplies stores, as well as domestic and international shipping services. It serves individuals, small businesses, home offices, medium-size businesses, large enterprises, e-commerce merchants, large retailers, and warehouse shippers. The company was formerly known as StampMaster, Inc. and changed its name to Stamps.com Inc. in December 1998. Stamps.com Inc. was founded in 1996 and is headquartered in El Segundo, California. |
Stock Price Prediction |
Update at 5:00pm EST |
If tomorrow:
|
Open lower
|
Open higher
|
High:
|
241.015 - 241.727 |
241.727 - 242.525 |
Low:
|
230.711 - 231.574 |
231.574 - 232.541 |
Close:
|
239.133 - 240.466 |
240.466 - 241.958 |
|
Technical analysis |
as of: 2021-01-26 4:49:14 PM |
Overall:
|
|
Stoxline posted a BUY today, same as yesterday. Upward movement continues. |
Target: |
Six months: 281.58 One year: 328.89 |
Support: |
Support1: 212.87 Support2: 195.43 |
Resistance: |
Resistance1: 241.08 Resistance2: 281.58 |
Pivot: |
217.76  |
Moving Average: |
MA(5): 230.89 MA(20): 215.29 
MA(100): 220.46 MA(250): 193.89  |
MACD: |
MACD(12,26): 7.23 Signal(9): 4.34  |
Stochastic oscillator: |
%K(14,3): 96.81 %D(3): 95.20  |
RSI: |
RSI(14): 72.63  |
52-week: |
High: 325.13 Low: 73.14 Change(%): 203.2 |
Average Vol(K): |
3-Month: 35932 10-Days: 26387 |
|
Price, moving averages and Bollinger Bands |
Price and moving averages has closed above its Short term moving average. Short term moving average is currently above mid-term; AND below long term moving averages. From the relationship between price and moving averages; we can see that: This stock is BULLISH in short-term; and NEUTRAL in mid-long term.STMP has closed above the upper band by 3.6%. If price is in a uptrend band; this upward trend in price might continue. However a short term pullback inside the band is likely.Bollinger Bands are 11.7% narrower than normal. The current width of the bands does not suggest anything about the future direction or movement of prices. |
|
Headline News |
Tue, 26 Jan 2021 Stamps.com Inc. (STMP) Soars 1.3% on January 26 - Equities.com
Mon, 25 Jan 2021 Stamps.com Inc. (STMP) Soars 2.8% on January 25 - Equities.com
Fri, 22 Jan 2021 Stamps.com Inc. (STMP) Soars 2.63% on January 22 - Equities.com
Wed, 20 Jan 2021 Stamps.com Inc. (STMP) Soars 2.94% on January 20 - Equities.com
Tue, 12 Jan 2021 Is There More To The Story Than Stamps.com's (NASDAQ:STMP) Earnings Growth? - Simply Wall St
Thu, 07 Jan 2021 Stamps.com Inc. (STMP) Soars 1.46% on January 07 - Equities.com
|
Financial Analysis |
Growth |
 |
Growth measures the growth of both a company's revenue and net income. it tells investors how fast a company is growing. |
Profitability |
 |
Profitability measures a company’s ability to generate earnings as compared to its expenses and other relevant costs. |
Solvency |
 |
Solvency measures a company's ability to meet its long-term debts. Acceptable solvency ratios will vary from industry to industry. |
Efficiency |
 |
Efficiency measures the strength of a company's return on invested capital. It can identify business that are better managed or not. |
Price to Book Value: |
Outperform |
Discounted cash flow: |
Outperform |
Return on Assets: |
Neutral |
Price to Earnings: |
Outperform |
Return on Equity: |
Neutral |
Debt to Equity: |
Neutral |
|
|
|
|
|
Free Technical Analysis Charts
|
|
Stock Basics & Statistics |
Exchange: NASDAQ |
Sector: Technology |
Industry: Software Application |
Shares Out. (M) |
18 |
Shares Float (M) |
18 |
% Held by Insiders
|
3.77 |
% Held by Institutions
|
90.63 |
Shares Short (K)
|
1,050 |
Shares Short P. Month (K)
|
948 |
Stock Financials |
EPS
|
8.200 |
EPS Est This Year
|
|
EPS Est Next Year
|
|
Book Value (p.s.)
|
49.920 |
Profit Margin
|
21.40 |
Operating Margin
|
24.16 |
Return on Assets (ttm)
|
10.4 |
Return on Equity (ttm)
|
19.9 |
Qtrly Rev. Growth
|
42.4 |
Gross Profit (p.s.)
|
22.842 |
Sales Per Share
|
39.084 |
EBITDA (p.s.)
|
10.885 |
Qtrly Earnings Growth
|
599.30 |
Operating Cash Flow (M)
|
216 |
Levered Free Cash Flow (M)
|
186 |
Stock Valuations |
PE Ratio
|
29.35 |
PEG Ratio
|
|
Price to Book value
|
4.82 |
Price to Sales
|
6.16 |
Price to Cash Flow
|
20.32 |
Stock Dividends |
Dividend
|
|
Forward Dividend
|
|
Dividend Yield
|
|
Dividend Pay Date
|
2010-12-01 |
Ex-Dividend Date
|
2010-11-07 |
7 Binary Options
|
Your Ad Here
|
|