
| 0.16 0.01 (6.38%) | 09-21 16:00 | |||||||||||||
|
|
| Short term |  |
|||
| Mid term |   |
|||
| Targets | 6-month : | 0.28 |
1-year : | 0.36 |
| Resists | First : | 0.24 |
Second : | 0.31 |
| Pivot price | 0.16 |
|||
| Supports | First : | 0.14 | Second : | 0.11 |
| MAs | MA(5) : | 0.15 |
MA(20) : | 0.16 |
| MA(100) : | 0.35 |
MA(250) : | 1.1 |
|
| MACD | MACD : | -0.1  |
Signal : | -0.1 |
| %K %D | K(14,3) : | 13.7 |
D(3) : | 10.6 |
| RSI | RSI(14): 39.7 |
|||
| 52-week | High : | 3.14 | Low : | 0.14 |
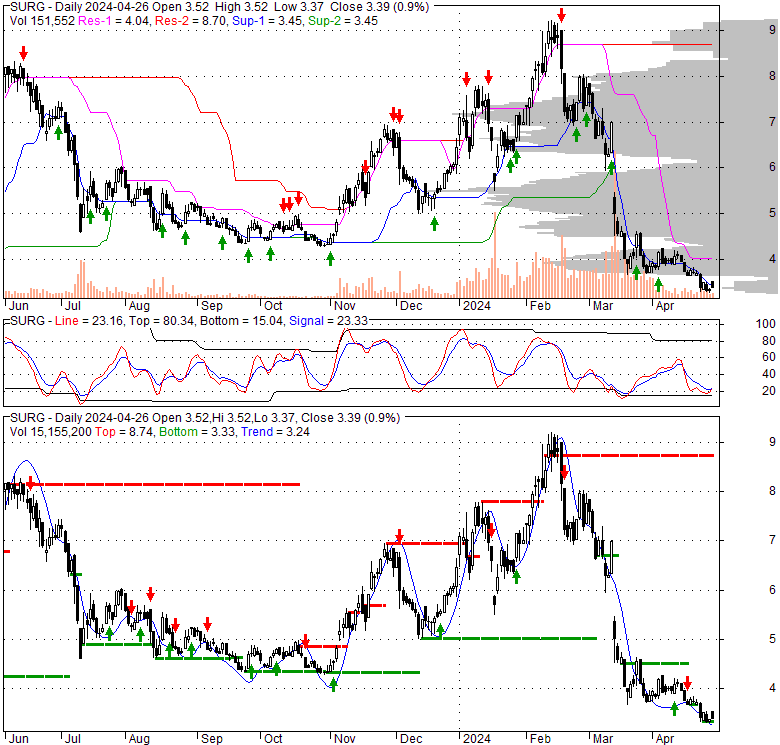
Price has closed above its short-term moving average. Short-term moving average is currently below mid-term; and below long-term moving average. From the relationship between price and moving averages: This stock is NEUTRAL in short-term; and BEARISH in mid-long term.[ SURG ] has closed above bottom band by 38.6%. Bollinger Bands are 81.9% narrower than normal. The narrow width of the bands suggests low volatility as compared to its normal range. The bands have been in this narrow range for 8 bars. This is a sign that the market may be about to initiate a new trend.
| If tomorrow: | Open lower | Open higher |
| High: | 0.16 - 0.16 | 0.16 - 0.16 |
| Low: | 0.15 - 0.15 | 0.15 - 0.15 |
| Close: | 0.16 - 0.16 | 0.16 - 0.16 |
SurgePays, Inc. operates as a financial technology and telecommunications enterprise dedicated to serving the underbanked communities across the United States. A core component of its strategy is a blockchain-powered platform that transforms local corner stores and bodegas into vital technology hubs, providing a suite of financial and prepaid products. In its telecommunications division, the company delivers voice and SMS messaging services to subsidized, direct retail prepaid, and low-income subscribers. Furthermore, it offers subsidized mobile broadband connectivity to consumers in California, Colorado, Florida, Illinois, Maryland, Mississippi, Missouri, Nevada, New Jersey, Ohio, Oklahoma, Rhode Island, Tennessee, and Texas, alongside traditional prepaid wireless options. Beyond these primary offerings, SurgePays also extends specialized services to law firms in the mass tort industry, including marketing business intelligence, plaintiff generation, and caseload management solutions. To support its diverse operations, the company maintains a bilingual operations center that provides essential internal functions such as sales assistance, customer service, IT infrastructure design, graphic media, database programming, software development, revenue assurance, and lead generation. The company's headquarters are located in Bartlett, Tennessee.
Thu, 17 Sep 2026
SurgePays (NASDAQ: SURG) Grants Director Weisberg Laurie 315,179 Shares at No Cost - Kalkine Media
Thu, 17 Sep 2026
SurgePays Signs Letter of Intent with LowWeeklyPayments to Form Smartphone Rent-to-Own Joint Venture - Quiver Quantitative
Thu, 17 Sep 2026
SurgePays and LowWeeklyPayments Sign Joint Venture LOI as - globenewswire.com
Thu, 17 Sep 2026
Phone rent-to-own program passes 100 dealers. SurgePays targets 500 locations by year-end. - Stock Titan
Wed, 16 Sep 2026
Auditor switch at SurgePays (SURG) follows prior going-concern warning - Stock Titan
Wed, 16 Sep 2026
SurgePays Inc. (SURG) Edges Lower to $0.15 as Shares Hover Near Key Support - Synthetic Short - careplusvn.com
| Price to Book Value: P/BV, a ratio used to compare book value to its current market price, to gauge whether a stock is valued properly. |
Underperform |
| Price to Earnings: PE, the ratio for valuing a company that measures its current share price relative to its earnings per share (EPS). |
Underperform |
| Discounted cash flow: DCF, a valuation method used to estimate the value of an investment based on its expected future cash flows. |
Outperform |
| Return on Assets: ROA, indicates how profitable a company is in relation to its total assets, how efficiently uses assets to generate a profit. |
Underperform |
| Return on Equity: ROE, a measure of financial performance calculated by dividing net income by equity. a gauge of profitability and efficiency. |
Outperform |
| Debt to Equity: evaluate financial leverage, reflects the ability of equity to cover outstanding debts in the event of a business downturn. |
Underperform |
|
Exchange:
NASDAQ
|
|
|
Sector:
Technology
|
|
|
Industry:
Software - Application
|
|
| Shares Out | 25 (M) |
| Shares Float | 44 (M) |
| Held by Insiders | 17.5 (%) |
| Held by Institutions | 4.3 (%) |
| Shares Short | 1,470 (K) |
| Shares Short P.Month | 2,350 (K) |
| EPS | -1.5 |
| EPS Est Next Qtrly | 0 |
| EPS Est This Year | 0 |
| EPS Est Next Year | 0 |
| Book Value (p.s.) | -0.78 |
| Profit Margin | -47.9 % |
| Operating Margin | 21.3 % |
| Return on Assets (ttm) | -122.8 % |
| Return on Equity (ttm) | 0 % |
| Qtrly Rev. Growth | 40.7 % |
| Gross Profit (p.s.) | -0.53 |
| Sales Per Share | 2.66 |
| EBITDA (p.s.) | -0.93 |
| Qtrly Earnings Growth | 0 % |
| Operating Cash Flow | -15 (M) |
| Levered Free Cash Flow | -1 (M) |
| PE Ratio | -0.11 |
| PEG Ratio | 0.4 |
| Price to Book value | -0.21 |
| Price to Sales | 0.05 |
| Price to Cash Flow | -0.26 |
| Dividend | 0 |
| Forward Dividend | 0 |
| Dividend Yield | 0% |
| Dividend Pay Date | Invalid DateTime. |
| Ex-Dividend Date | Invalid DateTime. |

|

|
|

|
|
|
|
|
|