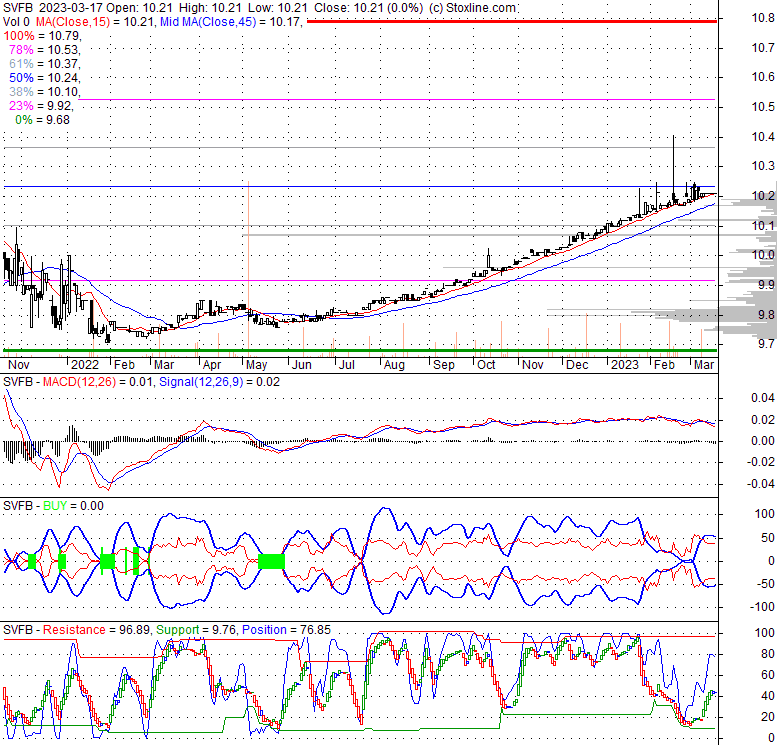
| 10.21 0 (0%) | 03-09 15:27 | |||||||||||||
|
|
| Short term | |
|||
| Mid term | |
|||
| Targets | 6-month : | 12.04 | 1-year : | 12.15 |
| Resists | First : | 10.31 | Second : | 10.4 |
| Pivot price | 10.21 |
|||
| Supports | First : | 10.15 | Second : | 8.45 |
| MAs | MA(5) : | 10.21 | MA(20) : | 10.2 |
| MA(100) : | 10.09 |
MA(250) : | 9.94 |
|
| MACD | MACD : | 0 |
Signal : | 0 |
| %K %D | K(14,3) : | 47.6 |
D(3) : | 49.2 |
| RSI | RSI(14): 58.4 | |||
| 52-week | High : | 10.4 | Low : | 9.76 |
Price has closed below its short-term moving average. Short-term moving average is currently above mid-term; and above long-term moving average. From the relationship between price and moving averages: This stock is NEUTRAL in short-term; and BULLISH in mid-long term.[ SVFB ] has closed above bottom band by 50.0%. Bollinger Bands are 18.4% narrower than normal. The current width of the bands does not suggest anything about the future direction or movement of prices.
| If tomorrow: | Open lower | Open higher |
| High: | 10.23 - 10.28 | 10.28 - 10.33 |
| Low: | 10.07 - 10.14 | 10.14 - 10.19 |
| Close: | 10.11 - 10.22 | 10.22 - 10.3 |
SVF Investment Corp. 2 does not have significant operations. The company focuses on effecting a merger, share exchange, asset acquisition, share purchase, reorganization, or similar business combination with one or more businesses. It intends to identify, acquire, and manage a business in a technology-enabled sector. The company was formerly known as SVF Investment II Corp. and changed its name to SVF Investment Corp. 2. in January 2021. SVF Investment Corp. 2 was incorporated in 2020 and is based in San Carlos, California.
Thu, 12 Jan 2023
SoftBank-Backed SVF Investment SPAC Set to Delist Shares, Refund Shareholders - Bloomberg
Tue, 04 Jan 2022
Still No 2022 SPAC Deal Announcements - Boardroom Alpha - TheStreet
Wed, 29 Dec 2021
SPACs Limping towards 2022, TPG Pace Beneficial (TPGY) and EVBox Cancel Merger - TheStreet
Tue, 21 Dec 2021
"Risk On" Sees Planet Labs and other Recent DeSPACs Surge - TheStreet
Wed, 12 May 2021
SoftBank Boosts Size of Vision Fund 2 to $30 Billion - Barron's
Thu, 06 May 2021
Will Honest's IPO Take More Shine Off SPACs? - TheStreet
| Price to Book Value: P/BV, a ratio used to compare book value to its current market price, to gauge whether a stock is valued properly. |
Neutral |
| Price to Earnings: PE, the ratio for valuing a company that measures its current share price relative to its earnings per share (EPS). |
Outperform |
| Discounted cash flow: DCF, a valuation method used to estimate the value of an investment based on its expected future cash flows. |
Outperform |
| Return on Assets: ROA, indicates how profitable a company is in relation to its total assets, how efficiently uses assets to generate a profit. |
Neutral |
| Return on Equity: ROE, a measure of financial performance calculated by dividing net income by equity. a gauge of profitability and efficiency. |
Neutral |
| Debt to Equity: evaluate financial leverage, reflects the ability of equity to cover outstanding debts in the event of a business downturn. |
Neutral |
|
Exchange:
NASDAQ
|
|
|
Sector:
Financial Services
|
|
|
Industry:
Shell Companies
|
|
| Shares Out | 24 (M) |
| Shares Float | 18 (M) |
| Held by Insiders | 4.6 (%) |
| Held by Institutions | 92.9 (%) |
| Shares Short | 18 (K) |
| Shares Short P.Month | 1 (K) |
| EPS | -0.12 |
| EPS Est Next Qtrly | 0 |
| EPS Est This Year | 0 |
| EPS Est Next Year | 0 |
| Book Value (p.s.) | -0.24 |
| Profit Margin | 0 % |
| Operating Margin | 0 % |
| Return on Assets (ttm) | 0 % |
| Return on Equity (ttm) | 0 % |
| Qtrly Rev. Growth | 0 % |
| Gross Profit (p.s.) | 0 |
| Sales Per Share | 0 |
| EBITDA (p.s.) | 0 |
| Qtrly Earnings Growth | 0 % |
| Operating Cash Flow | 0 (M) |
| Levered Free Cash Flow | 0 (M) |
| PE Ratio | -85.09 |
| PEG Ratio | 0 |
| Price to Book value | -42.55 |
| Price to Sales | 0 |
| Price to Cash Flow | -555.43 |
| Dividend | 0 |
| Forward Dividend | 0 |
| Dividend Yield | 0% |
| Dividend Pay Date | Invalid DateTime. |
| Ex-Dividend Date | Invalid DateTime. |

|

|
|

|
|
|
|
|
|