| 17.205 0.237 (1.4%) | 04-26 14:02 | |||||||||||||
|
|
| Short term | |
|||
| Mid term | |
|||
| Targets | 6-month : | 20.3 |
1-year : | 20.86 |
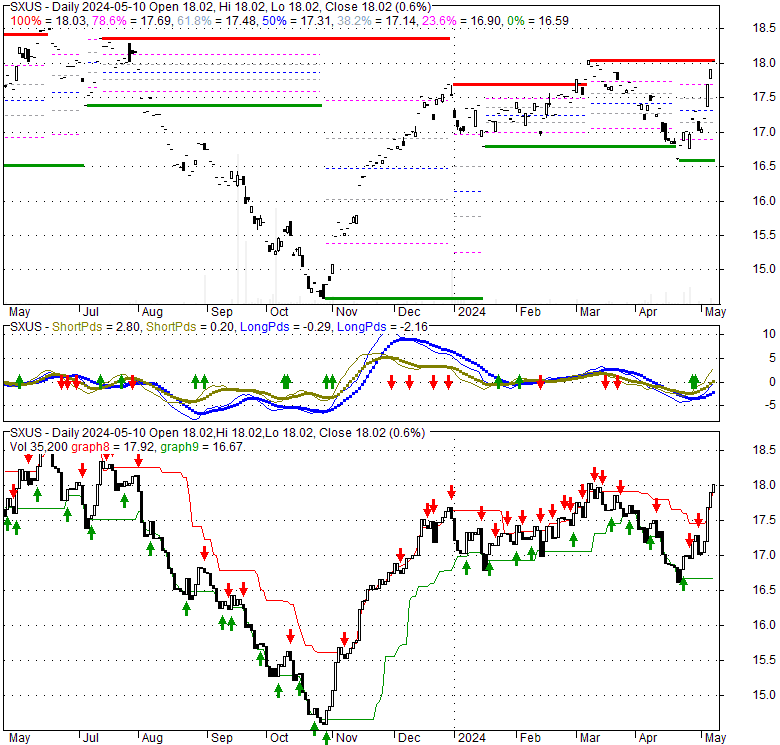
| Resists | First : | 17.38 |
Second : | 17.86 |
| Pivot price | 17.09 |
|||
| Supports | First : | 16.62 | Second : | 13.82 |
| MAs | MA(5) : | 16.99 |
MA(20) : | 17.18 |
| MA(100) : | 17.33 |
MA(250) : | 17.08 |
|
| MACD | MACD : | -0.2 |
Signal : | -0.2 |
| %K %D | K(14,3) : | 48.9 |
D(3) : | 40.8 |
| RSI | RSI(14): 48.3 |
|||
| 52-week | High : | 18.62 | Low : | 14.57 |
Price has closed above its short-term moving average. Short-term moving average is currently below mid-term; and below long-term moving average. From the relationship between price and moving averages: This stock is NEUTRAL in short-term; and NEUTRAL in mid-long term.[ SXUS ] has closed below upper band by 40.8%. Bollinger Bands are 27.5% wider than normal. The current width of the bands does not suggest anything about the future direction or movement of prices.
| If tomorrow: | Open lower | Open higher |
| High: | 17.18 - 17.24 | 17.24 - 17.3 |
| Low: | 17 - 17.08 | 17.08 - 17.15 |
| Close: | 17.06 - 17.17 | 17.17 - 17.26 |
The fund invests, under normal circumstances, at least 80% of its net assets (plus any borrowings for investment purposes) in equity securities. The fund primarily invests in equity securities of companies that are economically tied to countries outside of the United States, including investments in emerging markets. The fund generally invests in a core group of 30-50 equity securities, which consist primarily of common stocks, but may also include other types of instruments, such as depository receipts and warrants.
Sat, 27 Apr 2024
How the (SXUS) price action is used to our Advantage - Stock Traders Daily
Fri, 10 Mar 2023
Kinaxis' Accelerated Growth Continues To Attract Analyst Attention But Retail Investors Fail To Take Notice - ValueWalk
Sun, 05 Jul 2015
Banco Latinoamericano de Comercio Exterior, S. A. (BLX) Stock Price, News & Analysis - MarketBeat
Thu, 04 Jun 2015
HDFC Bank (HDB) Stock Price, News & Analysis - MarketBeat
| Price to Book Value: P/BV, a ratio used to compare book value to its current market price, to gauge whether a stock is valued properly. |
Neutral |
| Price to Earnings: PE, the ratio for valuing a company that measures its current share price relative to its earnings per share (EPS). |
Neutral |
| Discounted cash flow: DCF, a valuation method used to estimate the value of an investment based on its expected future cash flows. |
Neutral |
| Return on Assets: ROA, indicates how profitable a company is in relation to its total assets, how efficiently uses assets to generate a profit. |
Neutral |
| Return on Equity: ROE, a measure of financial performance calculated by dividing net income by equity. a gauge of profitability and efficiency. |
Neutral |
| Debt to Equity: evaluate financial leverage, reflects the ability of equity to cover outstanding debts in the event of a business downturn. |
Neutral |
|
Exchange:
AMEX
|
|
|
Sector:
Financial Services
|
|
|
Industry:
Asset Management
|
|
| Shares Out | 0 (M) |
| Shares Float | 0 (M) |
| Held by Insiders | 0 (%) |
| Held by Institutions | 0 (%) |
| Shares Short | 0 (K) |
| Shares Short P.Month | 0 (K) |
| EPS | 0 |
| EPS Est Next Qtrly | 0 |
| EPS Est This Year | 0 |
| EPS Est Next Year | 0 |
| Book Value (p.s.) | 0 |
| Profit Margin | 0 % |
| Operating Margin | 0 % |
| Return on Assets (ttm) | 0 % |
| Return on Equity (ttm) | 0 % |
| Qtrly Rev. Growth | 0 % |
| Gross Profit (p.s.) | 0 |
| Sales Per Share | 0 |
| EBITDA (p.s.) | 0 |
| Qtrly Earnings Growth | 0 % |
| Operating Cash Flow | 0 (M) |
| Levered Free Cash Flow | 0 (M) |
| PE Ratio | 0 |
| PEG Ratio | 0 |
| Price to Book value | 0 |
| Price to Sales | 0 |
| Price to Cash Flow | 0 |
| Dividend | 0 |
| Forward Dividend | 0 |
| Dividend Yield | 0% |
| Dividend Pay Date | Invalid DateTime. |
| Ex-Dividend Date | Invalid DateTime. |

|

|
|

|
|
|
|
|
|