
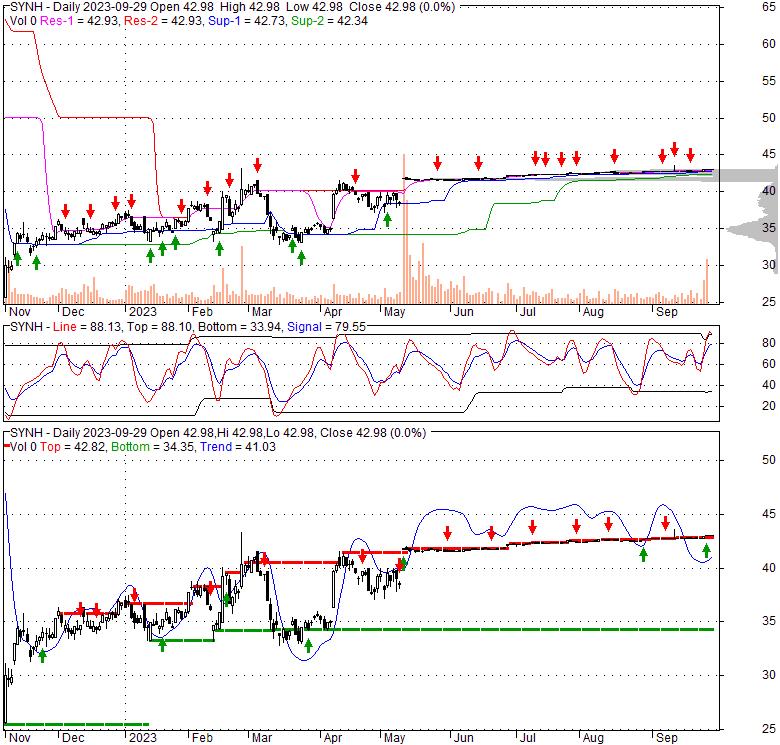
| 42.98 0.01 (0.02%) | 09-27 16:00 | |||||||||||||
|
|
| Short term |  |
|||
| Mid term | |
|||
| Targets | 6-month : | 1-year : | ||
| Resists | First : | Second : | ||
| Pivot price | ||||
| Supports | First : | Second : | ||
| MAs | MA(5) : | MA(20) : | ||
| MA(100) : | MA(250) : | |||
| MACD | MACD : | Signal : | ||
| %K %D | K(14,3) : | D(3) : | ||
| RSI | RSI(14): | |||
| 52-week | High : | Low : | ||
| If tomorrow: | Open lower | Open higher |
| High: | - | - |
| Low: | - | - |
| Close: | - | - |
Syneos Health, Inc. is a prominent global provider of outsourced biopharmaceutical services, operating with a vast reach across North America, Europe, the Middle East, Africa, the Asia-Pacific region, and Latin America. The company structures its offerings into two principal segments: Clinical Solutions and Commercial Solutions. The Clinical Solutions segment is dedicated to supporting the complete clinical development journey, from Phase I through IV, for a diverse array of medical innovations including diagnostics, drugs, biologics, devices, and digital therapeutics. Its extensive service portfolio encompasses product development and regulatory consulting, project management, protocol formulation, investigational site selection, clinical monitoring, technology-enabled patient recruitment and engagement strategies, clinical home health support, initiatives promoting clinical trial diversity, biometrics, and regulatory affairs. Conversely, the Commercial Solutions segment focuses on market access and commercialization strategies. Its offerings include deployment solutions, comprehensive communication services (such as public relations, advertising, and medical communications), and expert consulting tailored for the pharmaceutical, biotechnology, and wider healthcare sectors. Established in 2010 and headquartered in Morrisville, North Carolina, the enterprise rebranded as Syneos Health, Inc. in January 2018, having previously operated as INC Research Holdings, Inc.
Sat, 05 Sep 2026
SYNH stock reflects Syneos Health’s move to go private - ad-hoc-news.de
Fri, 20 Mar 2026
Syneos Health, Inc. acquired Shanghai Bestudy Medical Technology Co., Ltd. - marketscreener.com
Thu, 28 Sep 2023
Syneos Health, Inc. acquired by a private investment consortium for approximately US$7.1 billion - Borden Ladner Gervais LLP (BLG)
Fri, 11 Aug 2023
Syneos Health (SYNH) to Go Private, Reports Q2 Performance - Yahoo Finance
| Price to Book Value: P/BV, a ratio used to compare book value to its current market price, to gauge whether a stock is valued properly. |
Neutral |
| Price to Earnings: PE, the ratio for valuing a company that measures its current share price relative to its earnings per share (EPS). |
Outperform |
| Discounted cash flow: DCF, a valuation method used to estimate the value of an investment based on its expected future cash flows. |
Outperform |
| Return on Assets: ROA, indicates how profitable a company is in relation to its total assets, how efficiently uses assets to generate a profit. |
Outperform |
| Return on Equity: ROE, a measure of financial performance calculated by dividing net income by equity. a gauge of profitability and efficiency. |
Neutral |
| Debt to Equity: evaluate financial leverage, reflects the ability of equity to cover outstanding debts in the event of a business downturn. |
Outperform |
|
Exchange:
NASDAQ
|
|
|
Sector:
Healthcare
|
|
|
Industry:
Medical - Diagnostics & Research
|
|
| Shares Out | 0 (M) |
| Shares Float | 0 (M) |
| Held by Insiders | (%) |
| Held by Institutions | (%) |
| Shares Short | 0 (K) |
| Shares Short P.Month | 0 (K) |
| EPS | |
| EPS Est Next Qtrly | |
| EPS Est This Year | |
| EPS Est Next Year | |
| Book Value (p.s.) | |
| Profit Margin | % |
| Operating Margin | % |
| Return on Assets (ttm) | % |
| Return on Equity (ttm) | % |
| Qtrly Rev. Growth | % |
| Gross Profit (p.s.) | |
| Sales Per Share | |
| EBITDA (p.s.) | |
| Qtrly Earnings Growth | % |
| Operating Cash Flow | 0 (M) |
| Levered Free Cash Flow | 0 (M) |
| PE Ratio | |
| PEG Ratio | |
| Price to Book value | |
| Price to Sales | |
| Price to Cash Flow |
| Dividend | |
| Forward Dividend | |
| Dividend Yield | 0% |
| Dividend Pay Date | |
| Ex-Dividend Date |

|

|
|

|
|
|
|
|
|