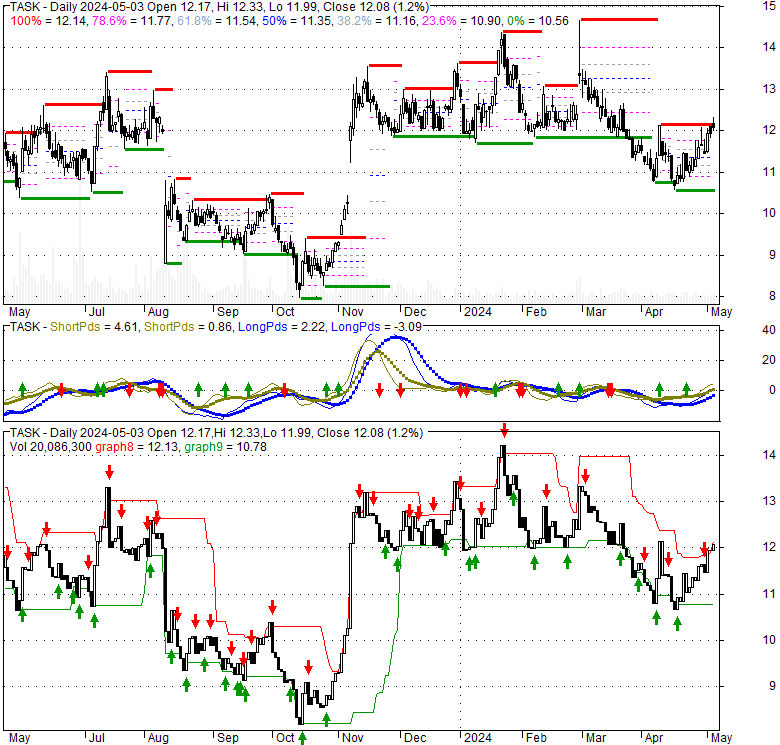
| 11.3 -0.06 (-0.53%) | 04-25 16:00 | |||||||||||||
|
|
| Short term | |
|||
| Mid term | |
|||
| Targets | 6-month : | 13.86 | 1-year : | 14.81 |
| Resists | First : | 11.87 | Second : | 12.68 |
| Pivot price | 11.19 |
|||
| Supports | First : | 10.56 | Second : | 8.78 |
| MAs | MA(5) : | 11.25 |
MA(20) : | 11.23 |
| MA(100) : | 12.25 |
MA(250) : | 11.44 |
|
| MACD | MACD : | -0.3 |
Signal : | -0.3 |
| %K %D | K(14,3) : | 44.9 |
D(3) : | 41.7 |
| RSI | RSI(14): 47.9 |
|||
| 52-week | High : | 14.67 | Low : | 7.94 |
Price has closed above its short-term moving average. Short-term moving average is currently below mid-term; and below long-term moving average. From the relationship between price and moving averages: This stock is NEUTRAL in short-term; and BEARISH in mid-long term.[ TASK ] has closed below upper band by 43.0%. Bollinger Bands are 10.8% narrower than normal. The current width of the bands does not suggest anything about the future direction or movement of prices.
| If tomorrow: | Open lower | Open higher |
| High: | 11.8 - 11.87 | 11.87 - 11.92 |
| Low: | 11 - 11.07 | 11.07 - 11.12 |
| Close: | 11.19 - 11.3 | 11.3 - 11.4 |
TaskUs, Inc. provides digital outsourcing services for companies worldwide. It offers digital customer experience that consists of omni-channel customer care services primarily delivered through digital channels; and other solutions, including customer care services for new product or market launches, trust and safety solutions, and customer acquisition solutions. The company also offers content security services, such as review and disposition of user and advertiser generated content, which include removal or labeling of policy violating, and offensive or misleading content; and artificial intelligence (AI) solutions that consist of data labeling, annotation, and transcription services for training and tuning AI algorithms through the process of machine learning. It serves clients in various industry segments within the digital economy, including e-commerce, FinTech, food delivery and ride sharing, gaming, HiTech, HealthTech, social media, and streaming media. The company was formerly known as TU TopCo, Inc. and changed its name to TaskUs, Inc. in December 2020. TaskUs, Inc. was founded in 2008 and is headquartered in New Braunfels, Texas.
Wed, 17 Apr 2024
TaskUs (NASDAQ:TASK) Stock Price Up 3.3% - MarketBeat
Wed, 17 Apr 2024
TaskUs, Inc. to Announce First Quarter 2024 Financial Results on May 8, 2024 - Business Wire
Thu, 11 Apr 2024
TASKUS ALERT: Bragar Eagel & Squire, P.C. is Investigating - GlobeNewswire
Thu, 11 Apr 2024
TASKUS ALERT: Bragar Eagel & Squire, P.C. is Investigating TaskUs, Inc. on Behalf of ... - The Bakersfield Californian
Sat, 06 Apr 2024
Individual investors invested in TaskUs, Inc. (NASDAQ:TASK) copped the brunt of last week's US$76m market cap ... - Yahoo Finance
Fri, 05 Apr 2024
TaskUs, Inc.'s (NASDAQ:TASK) Popularity With Investors Is Clear - Simply Wall St
| Price to Book Value: P/BV, a ratio used to compare book value to its current market price, to gauge whether a stock is valued properly. |
Neutral |
| Price to Earnings: PE, the ratio for valuing a company that measures its current share price relative to its earnings per share (EPS). |
Neutral |
| Discounted cash flow: DCF, a valuation method used to estimate the value of an investment based on its expected future cash flows. |
Outperform |
| Return on Assets: ROA, indicates how profitable a company is in relation to its total assets, how efficiently uses assets to generate a profit. |
Outperform |
| Return on Equity: ROE, a measure of financial performance calculated by dividing net income by equity. a gauge of profitability and efficiency. |
Outperform |
| Debt to Equity: evaluate financial leverage, reflects the ability of equity to cover outstanding debts in the event of a business downturn. |
Outperform |

|
Exchange:
NASDAQ
|
|
|
Sector:
Technology
|
|
|
Industry:
Information Technology Services
|
|
| Shares Out | 19 (M) |
| Shares Float | 17 (M) |
| Held by Insiders | 8.8 (%) |
| Held by Institutions | 99.7 (%) |
| Shares Short | 1,710 (K) |
| Shares Short P.Month | 1,150 (K) |
| EPS | 0.47 |
| EPS Est Next Qtrly | 0 |
| EPS Est This Year | 0 |
| EPS Est Next Year | 0 |
| Book Value (p.s.) | 4.96 |
| Profit Margin | 4.9 % |
| Operating Margin | 14.5 % |
| Return on Assets (ttm) | 7.5 % |
| Return on Equity (ttm) | 10.1 % |
| Qtrly Rev. Growth | -3.3 % |
| Gross Profit (p.s.) | 0 |
| Sales Per Share | 48.49 |
| EBITDA (p.s.) | 8.76 |
| Qtrly Earnings Growth | 20.8 % |
| Operating Cash Flow | 144 (M) |
| Levered Free Cash Flow | 124 (M) |
| PE Ratio | 23.54 |
| PEG Ratio | 0.9 |
| Price to Book value | 2.27 |
| Price to Sales | 0.23 |
| Price to Cash Flow | 1.49 |
| Dividend | 0 |
| Forward Dividend | 0 |
| Dividend Yield | 0% |
| Dividend Pay Date | Invalid DateTime. |
| Ex-Dividend Date | Invalid DateTime. |