
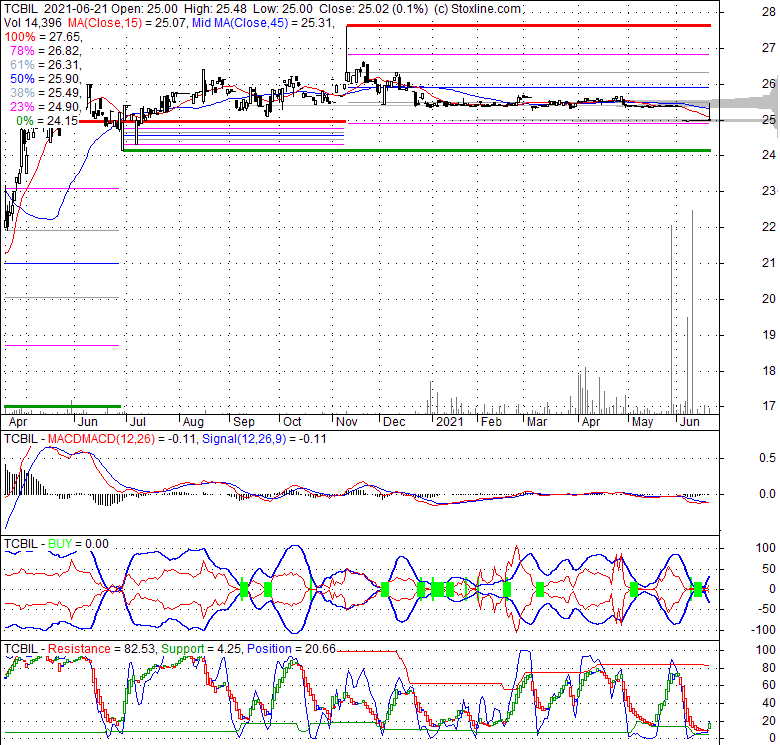
| 25.02 0.02 (0.08%) | 04-24 15:47 | |||||||||||||
|
|
| Short term |  |
|||
| Mid term | |
|||
| Targets | 6-month : | 1-year : | ||
| Resists | First : | Second : | ||
| Pivot price | ||||
| Supports | First : | Second : | ||
| MAs | MA(5) : | MA(20) : | ||
| MA(100) : | MA(250) : | |||
| MACD | MACD : | Signal : | ||
| %K %D | K(14,3) : | D(3) : | ||
| RSI | RSI(14): | |||
| 52-week | High : | Low : | ||
| If tomorrow: | Open lower | Open higher |
| High: | - | - |
| Low: | - | - |
| Close: | - | - |
Texas Capital Bancshares, Inc. functions as the parent entity for Texas Capital Bank, National Association, delivering a comprehensive suite of financial products and services. The institution primarily caters to commercial enterprises, independent professionals, and burgeoning entrepreneurs. Its offerings include a variety of business deposit solutions, such as commercial checking accounts, lockbox services, and cash concentration accounts. These are complemented by extensive treasury management functionalities, encompassing detailed information reporting, streamlined wire and ACH payment initiation, automated account transfers, and seamless service integration. For individual customers, the bank provides standard deposit vehicles like checking accounts, savings accounts, money market accounts, and certificates of deposit. On the lending front, Texas Capital Bank extends commercial financing tailored for diverse corporate objectives, including operational capital, organic expansion, and strategic acquisitions, alongside financing for business insurance premiums. It also offers real estate loans, covering both term and construction projects. Further specialized financial products include mortgage warehouse facilities, mortgage correspondent aggregation services, and equipment leasing and finance. Additional services encompass comprehensive treasury management (featuring online banking and debit/credit card facilities), escrow administration, and the issuance of letters of credit. Clients can also access personal wealth management and trust services, along with both secured and unsecured loan options. Digital convenience is emphasized through robust online and mobile banking platforms. A distinctive feature is its dedicated all-digital branch, the American Airlines AAdvantage program, specifically designed for depositors. Operationally, the company is active across key metropolitan areas in Texas, including Austin, Dallas, Fort Worth, Houston, and San Antonio. Established in 1996, Texas Capital Bancshares, Inc. maintains its corporate headquarters in Dallas, Texas.
Tue, 07 Sep 2021
Texas Capital Bancshares Inc Pref 09/21/2042 | 4: Statement of changes in beneficial ownership of securities - Moomoo
| Price to Book Value: P/BV, a ratio used to compare book value to its current market price, to gauge whether a stock is valued properly. |
Underperform |
| Price to Earnings: PE, the ratio for valuing a company that measures its current share price relative to its earnings per share (EPS). |
Neutral |
| Discounted cash flow: DCF, a valuation method used to estimate the value of an investment based on its expected future cash flows. |
Outperform |
| Return on Assets: ROA, indicates how profitable a company is in relation to its total assets, how efficiently uses assets to generate a profit. |
Outperform |
| Return on Equity: ROE, a measure of financial performance calculated by dividing net income by equity. a gauge of profitability and efficiency. |
Neutral |
| Debt to Equity: evaluate financial leverage, reflects the ability of equity to cover outstanding debts in the event of a business downturn. |
Neutral |
|
Exchange:
NASDAQ
|
|
|
Sector:
Financial Services
|
|
|
Industry:
Banks - Regional
|
|
| Shares Out | 0 (M) |
| Shares Float | 0 (M) |
| Held by Insiders | (%) |
| Held by Institutions | (%) |
| Shares Short | 0 (K) |
| Shares Short P.Month | 0 (K) |
| EPS | |
| EPS Est Next Qtrly | |
| EPS Est This Year | |
| EPS Est Next Year | |
| Book Value (p.s.) | |
| Profit Margin | % |
| Operating Margin | % |
| Return on Assets (ttm) | % |
| Return on Equity (ttm) | % |
| Qtrly Rev. Growth | % |
| Gross Profit (p.s.) | |
| Sales Per Share | |
| EBITDA (p.s.) | |
| Qtrly Earnings Growth | % |
| Operating Cash Flow | 0 (M) |
| Levered Free Cash Flow | 0 (M) |
| PE Ratio | |
| PEG Ratio | |
| Price to Book value | |
| Price to Sales | |
| Price to Cash Flow |
| Dividend | |
| Forward Dividend | |
| Dividend Yield | 0% |
| Dividend Pay Date | |
| Ex-Dividend Date |

|

|

|

|
|
|
|
|
|