
| 34.87 -2.517 (-6.73%) | 11-20 15:55 | |||||||||||||
|
|
| Short term |  |
|||
| Mid term |   |
|||
| Targets | 6-month : | 44.25 |
1-year : | 46.42 |
| Resists | First : | 37.88 |
Second : | 39.74 |
| Pivot price | 37.61 |
|||
| Supports | First : | 34.86 |
Second : | 29.01 |
| MAs | MA(5) : | 37.12 |
MA(20) : | 38.03 |
| MA(100) : | 36.63 |
MA(250) : | 38.97 |
|
| MACD | MACD : | -0.2 |
Signal : | 0.1 |
| %K %D | K(14,3) : | 40.2 |
D(3) : | 53.1 |
| RSI | RSI(14): 36.3 |
|||
| 52-week | High : | 46.27 | Low : | 31.23 |
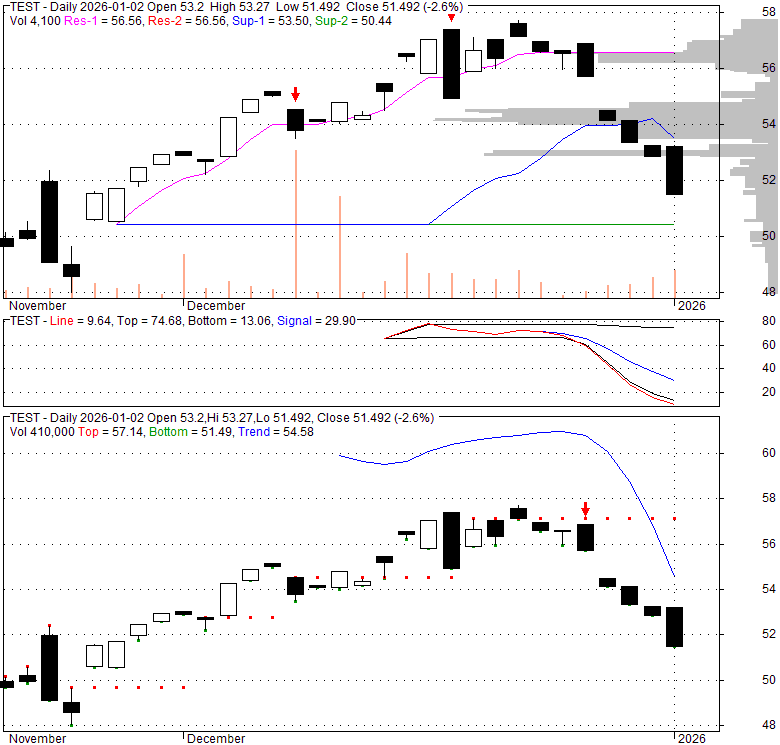
Price has closed below its short-term moving average. Short-term moving average is currently below mid-term; and above long-term moving average. From the relationship between price and moving averages: This stock is BEARISH in short-term; and NEUTRAL in mid-long term.[ TEST ] has closed below the lower bollinger band by 3.4%. Bollinger Bands are 9.2% wider than normal. The current width of the bands does not suggest anything about the future direction or movement of prices.
| If tomorrow: | Open lower | Open higher |
| High: | 37.08 - 37.29 | 37.29 - 37.52 |
| Low: | 34.3 - 34.53 | 34.53 - 34.77 |
| Close: | 34.45 - 34.84 | 34.84 - 35.26 |
TEST aims for current income by combining synthetic long exposure to Tesla, Inc. (TSLA) and other options strategies, collateralized by cash and US Treasurys. TSLA engages in the design, development, manufacture, and sale of electric vehicles and energy generation and storage systems. The fund aims for monthly premiums of approximately 2.2% and an annual cash distribution target of about 25% of the funds NAV. Synthetic exposure is created by pairing long call options with short put options on TSLA, replicating the stocks price movements, subject to limits on potential gains. To generate premiums, the fund employs various options strategies, such as covered call spread that sells call options while buying calls at a higher strike, capping both profit and loss. The strategy may generate income but limits participation in potential gains if TSLA shares increase in value. On a weekly basis, the adviser uses one or more options strategies.
Fri, 20 Nov 2026
EDGAR Filing Documents for 0001999371-26-025918 - SEC.gov
Mon, 17 Aug 2026
YieldMax® ETFs Announces Distributions on MSST, NVIT, and TEST - GlobeNewswire
Mon, 15 Jun 2026
YieldMax® ETFs Announces Distributions on MSST, NVIT, and TEST - GlobeNewswire
Sun, 23 Nov 2025
YieldMax MSTR Performance & Distribution Target 25 ETF (MSST) Stock Price, News, Quote & History - Yahoo! Finance Canada
Tue, 18 Nov 2025
YieldMax® Launches New Fund Family Focused on Growth + Income: Performance and Distribution Target 25™ ETFs - ETFGI
Tue, 30 Sep 2025
YieldMax TSLA Performance & Distribution Target 25 ETF (TEST) stock price, news, quote and history - Yahoo Finance Singapore
| Price to Book Value: P/BV, a ratio used to compare book value to its current market price, to gauge whether a stock is valued properly. |
Neutral |
| Price to Earnings: PE, the ratio for valuing a company that measures its current share price relative to its earnings per share (EPS). |
Neutral |
| Discounted cash flow: DCF, a valuation method used to estimate the value of an investment based on its expected future cash flows. |
Neutral |
| Return on Assets: ROA, indicates how profitable a company is in relation to its total assets, how efficiently uses assets to generate a profit. |
Neutral |
| Return on Equity: ROE, a measure of financial performance calculated by dividing net income by equity. a gauge of profitability and efficiency. |
Neutral |
| Debt to Equity: evaluate financial leverage, reflects the ability of equity to cover outstanding debts in the event of a business downturn. |
Neutral |
|
Exchange:
CBOE
|
|
|
Sector:
Financial Services
|
|
|
Industry:
Asset Management - Income
|
|
| Shares Out | 0 (M) |
| Shares Float | 0 (M) |
| Held by Insiders | 0 (%) |
| Held by Institutions | 0 (%) |
| Shares Short | 0 (K) |
| Shares Short P.Month | 0 (K) |
| EPS | 0 |
| EPS Est Next Qtrly | 0 |
| EPS Est This Year | 0 |
| EPS Est Next Year | 0 |
| Book Value (p.s.) | 0 |
| Profit Margin | 0 % |
| Operating Margin | 0 % |
| Return on Assets (ttm) | 0 % |
| Return on Equity (ttm) | 0 % |
| Qtrly Rev. Growth | 0 % |
| Gross Profit (p.s.) | 0 |
| Sales Per Share | 0 |
| EBITDA (p.s.) | 0 |
| Qtrly Earnings Growth | 0 % |
| Operating Cash Flow | 0 (M) |
| Levered Free Cash Flow | 0 (M) |
| PE Ratio | 0 |
| PEG Ratio | 0 |
| Price to Book value | 0 |
| Price to Sales | 0 |
| Price to Cash Flow | 0 |
| Dividend | 0 |
| Forward Dividend | 0 |
| Dividend Yield | 0% |
| Dividend Pay Date | Invalid DateTime. |
| Ex-Dividend Date | Invalid DateTime. |

|

|

|

|
|
|
|
|
|