
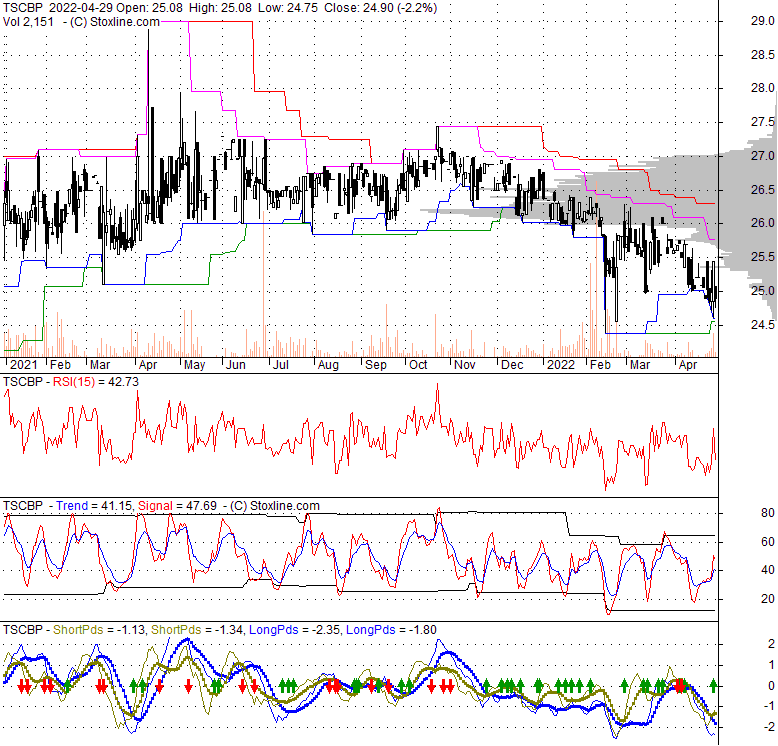
| 24.54 -0.13 (-0.53%) | 04-24 15:47 | |||||||||||||
|
|
| Short term |  |
|||
| Mid term | |
|||
| Targets | 6-month : | 1-year : | ||
| Resists | First : | Second : | ||
| Pivot price | ||||
| Supports | First : | Second : | ||
| MAs | MA(5) : | MA(20) : | ||
| MA(100) : | MA(250) : | |||
| MACD | MACD : | Signal : | ||
| %K %D | K(14,3) : | D(3) : | ||
| RSI | RSI(14): | |||
| 52-week | High : | Low : | ||
| If tomorrow: | Open lower | Open higher |
| High: | - | - |
| Low: | - | - |
| Close: | - | - |
TriState Capital Holdings, Inc. functions as the parent company for TriState Capital Bank, delivering a broad spectrum of commercial and private banking services. Its clientele primarily consists of middle-market enterprises and affluent individuals throughout the United States. The firm's activities are organized into two primary divisions: Banking and Investment Management. Within its banking operations, deposit offerings include checking accounts, money market accounts, and certificates of deposit, alongside specialized services like Promontory's Certificate of Deposit Account Registry Services and Insured Cash Sweep. The company also extends various credit facilities, such as loans collateralized by cash, marketable securities, life insurance cash value, or residential property. Additional lending products feature commercial and industrial loans, commercial real estate loans, personal loans, asset-based financing, acquisition funding, and letters of credit. Furthermore, TriState Capital provides comprehensive liquidity and treasury management solutions, encompassing online balance reporting, bill payment, remote deposit, wire transfers, automated clearing house services, foreign exchange, and controlled disbursements. The Investment Management segment offers equity and fixed income advisory and sub-advisory services. These services cater to third-party and series trust mutual funds, as well as separately managed accounts for ultra-high-net-worth individuals and institutional clients, including corporations, ERISA plans, Taft-Hartley funds, municipalities, endowments, and foundations. The company also handles cash management, capital market activities like interest rate swaps and investment products, and engages in the wholesale distribution and marketing of its investment offerings. Established in 2006, TriState Capital Holdings is headquartered in Pittsburgh, Pennsylvania. It operates from its main office there and through four additional representative offices located in Cleveland, Ohio; Philadelphia, Pennsylvania; Edison, New Jersey; and New York, New York.
Thu, 24 Apr 2025
Tristate Capital (TSC) Stock Price, News & Analysis - Stock Titan
| Price to Book Value: P/BV, a ratio used to compare book value to its current market price, to gauge whether a stock is valued properly. |
Outperform |
| Price to Earnings: PE, the ratio for valuing a company that measures its current share price relative to its earnings per share (EPS). |
Outperform |
| Discounted cash flow: DCF, a valuation method used to estimate the value of an investment based on its expected future cash flows. |
Outperform |
| Return on Assets: ROA, indicates how profitable a company is in relation to its total assets, how efficiently uses assets to generate a profit. |
Neutral |
| Return on Equity: ROE, a measure of financial performance calculated by dividing net income by equity. a gauge of profitability and efficiency. |
Neutral |
| Debt to Equity: evaluate financial leverage, reflects the ability of equity to cover outstanding debts in the event of a business downturn. |
Outperform |
|
Exchange:
NASDAQ
|
|
|
Sector:
Financial Services
|
|
|
Industry:
Banks - Regional
|
|
| Shares Out | 0 (M) |
| Shares Float | 0 (M) |
| Held by Insiders | (%) |
| Held by Institutions | (%) |
| Shares Short | 0 (K) |
| Shares Short P.Month | 0 (K) |
| EPS | |
| EPS Est Next Qtrly | |
| EPS Est This Year | |
| EPS Est Next Year | |
| Book Value (p.s.) | |
| Profit Margin | % |
| Operating Margin | % |
| Return on Assets (ttm) | % |
| Return on Equity (ttm) | % |
| Qtrly Rev. Growth | % |
| Gross Profit (p.s.) | |
| Sales Per Share | |
| EBITDA (p.s.) | |
| Qtrly Earnings Growth | % |
| Operating Cash Flow | 0 (M) |
| Levered Free Cash Flow | 0 (M) |
| PE Ratio | |
| PEG Ratio | |
| Price to Book value | |
| Price to Sales | |
| Price to Cash Flow |
| Dividend | |
| Forward Dividend | |
| Dividend Yield | 0% |
| Dividend Pay Date | |
| Ex-Dividend Date |

|

|

|

|
|
|
|
|
|