
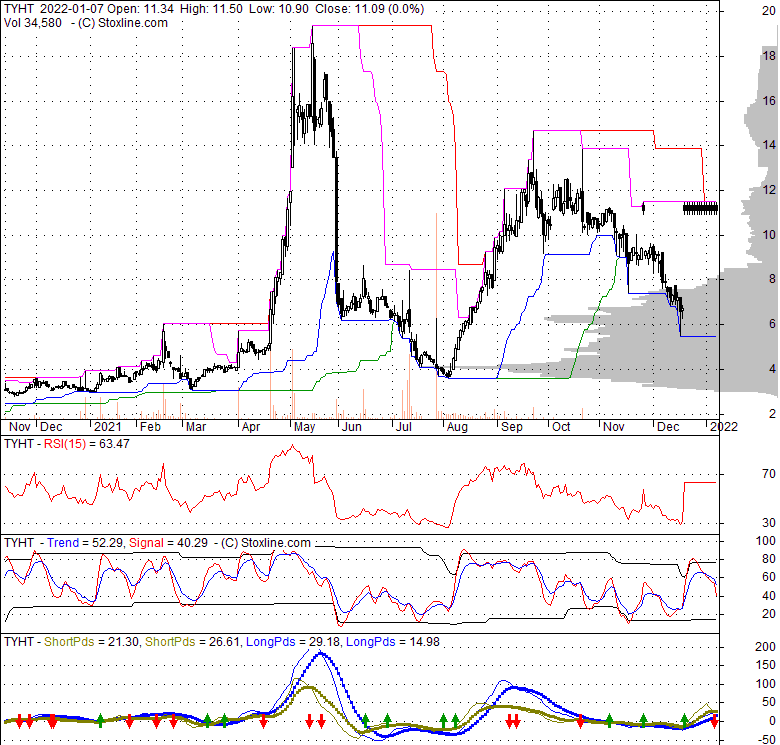
| 11.09 -0.45 (-3.9%) | 10-18 00:00 | |||||||||||||
|
|
| Short term |  |
|||
| Mid term | |
|||
| Targets | 6-month : | 1-year : | ||
| Resists | First : | Second : | ||
| Pivot price | ||||
| Supports | First : | Second : | ||
| MAs | MA(5) : | MA(20) : | ||
| MA(100) : | MA(250) : | |||
| MACD | MACD : | Signal : | ||
| %K %D | K(14,3) : | D(3) : | ||
| RSI | RSI(14): | |||
| 52-week | High : | Low : | ||
| If tomorrow: | Open lower | Open higher |
| High: | - | - |
| Low: | - | - |
| Close: | - | - |
Shineco, Inc. functions as a holding company, primarily involved in the creation and supply of plant-derived goods through its extensive network of subsidiaries. Based in Beijing, China, the firm maintains a workforce of 380 full-time employees. It delivers health and wellness-focused plant products by leveraging the integrated, vertically and horizontally structured production, distribution, and sales channels of its subsidiaries and variable interest entities. The company's operations are divided into three distinct divisions. One division concentrates on the development, manufacturing, and distribution of specialized fabrics, textile items, and related by-products sourced from Apocynum Venetum, an indigenous Chinese plant also known as Bluish Dogbane or Luobuma. A second division is dedicated to the cultivation, processing, and distribution of traditional Chinese medicinal herbs and various other pharmaceutical goods. The third division encompasses the planting, processing, and distribution of eco-friendly and organic agricultural produce, alongside the cultivation of Chinese Yew trees. Employing advanced engineering and biotechnological methods, Shineco produces a range of items, including Chinese herbal remedies, organic farm products, and unique textiles.
Thu, 01 Aug 2019
Shineco, Inc. Announces Entry into Strategic Cooperation - GlobeNewswire
Thu, 20 Jul 2017
TYHT Upcoming IPO — All Pre-IPO Details - TradingView
| Price to Book Value: P/BV, a ratio used to compare book value to its current market price, to gauge whether a stock is valued properly. |
Outperform |
| Price to Earnings: PE, the ratio for valuing a company that measures its current share price relative to its earnings per share (EPS). |
Underperform |
| Discounted cash flow: DCF, a valuation method used to estimate the value of an investment based on its expected future cash flows. |
Outperform |
| Return on Assets: ROA, indicates how profitable a company is in relation to its total assets, how efficiently uses assets to generate a profit. |
Underperform |
| Return on Equity: ROE, a measure of financial performance calculated by dividing net income by equity. a gauge of profitability and efficiency. |
Underperform |
| Debt to Equity: evaluate financial leverage, reflects the ability of equity to cover outstanding debts in the event of a business downturn. |
Outperform |
|
Exchange:
NASDAQ
|
|
|
Sector:
Healthcare
|
|
|
Industry:
Drug Manufacturers - Specialty & Generic
|
|
| Shares Out | 0 (M) |
| Shares Float | 0 (M) |
| Held by Insiders | (%) |
| Held by Institutions | (%) |
| Shares Short | 0 (K) |
| Shares Short P.Month | 0 (K) |
| EPS | |
| EPS Est Next Qtrly | |
| EPS Est This Year | |
| EPS Est Next Year | |
| Book Value (p.s.) | |
| Profit Margin | % |
| Operating Margin | % |
| Return on Assets (ttm) | % |
| Return on Equity (ttm) | % |
| Qtrly Rev. Growth | % |
| Gross Profit (p.s.) | |
| Sales Per Share | |
| EBITDA (p.s.) | |
| Qtrly Earnings Growth | % |
| Operating Cash Flow | 0 (M) |
| Levered Free Cash Flow | 0 (M) |
| PE Ratio | |
| PEG Ratio | |
| Price to Book value | |
| Price to Sales | |
| Price to Cash Flow |
| Dividend | |
| Forward Dividend | |
| Dividend Yield | 0% |
| Dividend Pay Date | |
| Ex-Dividend Date |

|

|
|

|
|
|
|
|
|