| 17.7652 0 (0%) | 03-27 15:59 | |||||||||||||
|
|
| Short term | ||||
| Mid term | |
|||
| Targets | 6-month : | 30.01 |
1-year : | 30.83 |
| Resists | First : | 25.7 |
Second : | 26.39 |
| Pivot price | 25.6 |
|||
| Supports | First : | 24.56 |
Second : | 20.44 |
| MAs | MA(5) : | 25.4 |
MA(20) : | 25.68 |
| MA(100) : | 26.63 |
MA(250) : | 27.4 |
|
| MACD | MACD : | -0.2 |
Signal : | -0.2 |
| %K %D | K(14,3) : | 54.4 |
D(3) : | 54.1 |
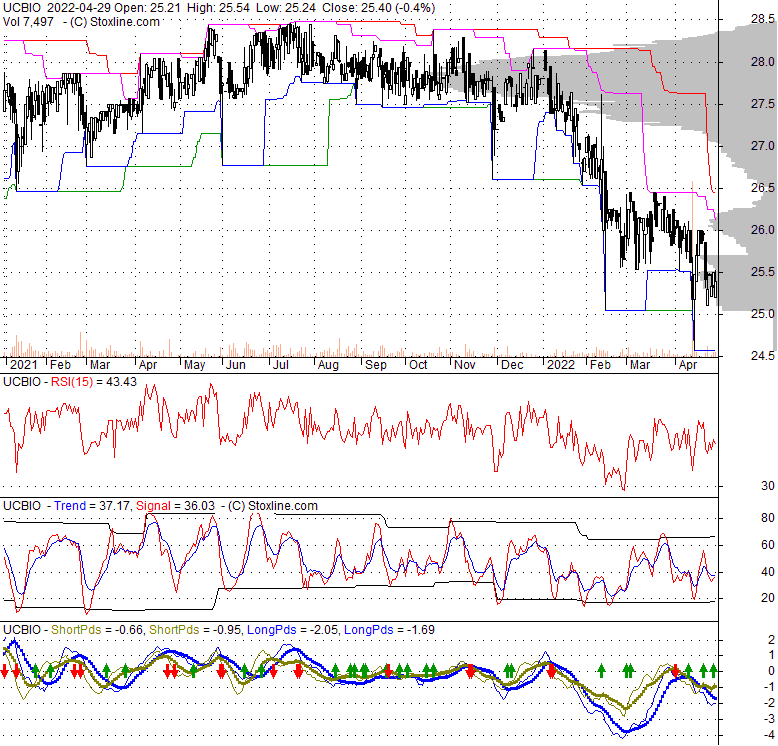
| RSI | RSI(14): 43.3 |
|||
| 52-week | High : | 28.48 | Low : | 24.56 |
Price has closed below its short-term moving average. Short-term moving average is currently below mid-term; and below long-term moving average. From the relationship between price and moving averages: This stock is BEARISH in short-term; and BEARISH in mid-long term.[ UCBIO ] has closed above bottom band by 30.4%. Bollinger Bands are 14.7% wider than normal. The current width of the bands does not suggest anything about the future direction or movement of prices.
| If tomorrow: | Open lower | Open higher |
| High: | 25.6 - 25.73 | 25.73 - 25.83 |
| Low: | 24.89 - 25.06 | 25.06 - 25.2 |
| Close: | 25.16 - 25.42 | 25.42 - 25.63 |
The investment seeks daily investment results, before fees and expenses, that correspond to three times (3x) the daily performance of the NASDAQ Biotechnology Index® (the "index"). The fund invests in financial instruments that ProShare Advisors believes, in combination, should produce daily returns consistent with the fund's investment objective. The index is a modified capitalization weighted index that includes securities of Nasdaq listed companies that are classified as either biotechnology or pharmaceutical. The fund is non-diversified.
Thu, 25 Apr 2019
Politics Weigh On Health Care ETFs | etf.com - etf.com
| Price to Book Value: P/BV, a ratio used to compare book value to its current market price, to gauge whether a stock is valued properly. |
Neutral |
| Price to Earnings: PE, the ratio for valuing a company that measures its current share price relative to its earnings per share (EPS). |
Neutral |
| Discounted cash flow: DCF, a valuation method used to estimate the value of an investment based on its expected future cash flows. |
Neutral |
| Return on Assets: ROA, indicates how profitable a company is in relation to its total assets, how efficiently uses assets to generate a profit. |
Neutral |
| Return on Equity: ROE, a measure of financial performance calculated by dividing net income by equity. a gauge of profitability and efficiency. |
Neutral |
| Debt to Equity: evaluate financial leverage, reflects the ability of equity to cover outstanding debts in the event of a business downturn. |
Neutral |
|
Exchange:
NASDAQ
|
|
|
Sector:
|
|
|
Industry:
|
|
| Shares Out | 0 (M) |
| Shares Float | 105 (M) |
| Held by Insiders | 0 (%) |
| Held by Institutions | 0 (%) |
| Shares Short | 15 (K) |
| Shares Short P.Month | 16 (K) |
| EPS | 3.06 |
| EPS Est Next Qtrly | 0 |
| EPS Est This Year | 0 |
| EPS Est Next Year | 0 |
| Book Value (p.s.) | 23.4 |
| Profit Margin | 36.2 % |
| Operating Margin | 50.1 % |
| Return on Assets (ttm) | 1.3 % |
| Return on Equity (ttm) | 12.7 % |
| Qtrly Rev. Growth | -5.4 % |
| Gross Profit (p.s.) | 0 |
| Sales Per Share | 0 |
| EBITDA (p.s.) | 0 |
| Qtrly Earnings Growth | -14.4 % |
| Operating Cash Flow | 359 (M) |
| Levered Free Cash Flow | 0 (M) |
| PE Ratio | 8.27 |
| PEG Ratio | 0 |
| Price to Book value | 1.08 |
| Price to Sales | 0 |
| Price to Cash Flow | 0 |
| Dividend | 0 |
| Forward Dividend | 0 |
| Dividend Yield | 0% |
| Dividend Pay Date | 2021-12-14 |
| Ex-Dividend Date | 2021-11-28 |

|

|
|

|
|
|
|
|
|